




Summary
Sizing a central preparation facility should begin with what the outlet network must receive, not with the nominal capacity printed on an equipment specification sheet. A defensible model for central kitchen capacity for restaurant chain operations converts meals or orders at each location into ingredient demand, applies menu occurrence and peak-day factors, works backward through processing yield to determine raw input, and then tests whether each preparation stage can handle that load within the real production window. The same calculation must also account for sanitation, SKU changeovers, breaks, planned downtime, cold-room dwell time and dispatch timing.
A network of 20, 50 or 100 locations therefore does not correspond to three universal factory sizes. Two 50-location chains can require very different central facilities when portion sizes, menus, delivery frequency, raw-material condition, RTE versus RTC responsibility or outlet storage limits differ. The practical objective is to build an adjustable outlet-to-capacity model that reveals the required daily volume, stage rates, shift structure, storage load and operational buffer before equipment is selected. The worked scenario below demonstrates the method with transparent hypothetical assumptions; it is a planning model, not a benchmark or guaranteed equipment configuration.
Build Central Kitchen Capacity for Restaurant Chain Demand from Outlet Requirements
A common sizing error is to begin with a statement such as “we need a 1,000 kg/h vegetable line” and work backward to find enough production to justify it. That reverses the engineering logic. The more useful question is: how much accepted product must leave the central facility, in which SKUs, at what times, so that the outlet network can execute its menu without excessive local preparation or inventory?
The starting dataset normally comes from POS records, standardized recipes, purchasing records, outlet forecasts and actual preparation yields. The model should distinguish an average day from the planning day. If Friday demand is materially higher than Tuesday demand, a line designed only around annual average volume can be undersized precisely when the network is under the greatest service pressure.
The first core equation is:
Saleable daily requirement = active locations × meals or orders per location × ingredient grams per meal × menu occurrence factor × peak-day factor
The menu occurrence factor prevents the model from assuming that every order contains every centrally prepared ingredient. If 65% of orders contain a particular prepared vegetable component, the factor for that ingredient family is 0.65 rather than 1.00. For a complex menu, this should be calculated by SKU family rather than as one blended percentage.
Once accepted or saleable output is known, raw-material demand can be estimated:
Raw input = saleable output / expected processing yield
Yield here means the relationship between incoming raw material and the output that meets the chain’s defined specification after relevant trimming, peeling, sorting, washing, cutting or other preparation losses. It should not be copied from a generic brochure. The USDA Food Buying Guide illustrates the broader planning principle of translating portions and edible output into purchasing quantities, while also noting that yield changes with raw-product condition, storage, equipment and preparation method. Its formal scope is U.S. Child Nutrition Programs, so its example yields should not be treated as universal commercial-factory values.
For restaurant-chain engineering, the best source is normally the operator’s own documented yield history or controlled trials using representative raw materials. Seasonal variation may justify several yield assumptions rather than one annual number.
What Information Must Be Known Before Capacity Is Calculated?
Outlet count alone is one of the least informative inputs in the model. A 100-location beverage-led concept, a 100-location salad chain and a 100-location full-service restaurant group can place radically different loads on a central preparation facility. Even businesses with similar menus may centralize different tasks.
| Required input | Why it changes capacity | Typical owner | Preferred evidence |
|---|---|---|---|
| Active outlet count and planned openings | Defines current network demand and future expansion load. | Operations / development | Current store list and approved opening plan |
| Meals or orders per outlet | Converts network size into actual service demand. | Operations / finance | POS history by day and location |
| Ingredient grams per serving | Connects menu demand to required kilograms. | Culinary / product development | Standard recipes and portion specifications |
| SKU or menu occurrence rate | Prevents every ingredient from being assigned to every order. | Culinary / data team | POS item mix and bill-of-material data |
| Peak-day factor | Separates design demand from average demand. | Operations | Historical daily and seasonal demand |
| Raw-to-accepted yield | Determines purchasing and upstream processing load. | Production / QA | Plant records and representative yield trials |
| Processing frequency | Daily, alternate-day or campaign production changes required batch size and storage. | Production planning | Production schedule |
| Delivery frequency and dispatch waves | Changes finished-product accumulation and cold-room load. | Logistics | Route plan and delivery windows |
| Outlet receiving and storage limits | May prevent the central facility from simply producing and delivering larger batches. | Restaurant operations | Site surveys and storage layouts |
| Production, cleaning and changeover windows | Determines the hours in which equipment can actually process food. | Production / sanitation | Shift records and sanitation procedures |
| RTE, RTC and raw-product responsibilities | Changes process sequence, hygiene zoning and possible equipment separation. | QA / food safety / operations | Product classification and food-safety plan |
| Utilities and site constraints | Can limit simultaneous operation even when individual machines have adequate throughput. | Engineering | Layout, drainage, power, water and utility documentation |
Missing data does not necessarily stop early planning. It does mean assumptions must be labelled. An assumption such as “350 orders per outlet per day” is usable in a scenario model because it can later be replaced. An unsupported conclusion such as “50 outlets require a 500 kg/h line” is much harder to audit.
A Worked Outlet-to-Capacity Example for 20, 50 and 100 Locations
The following is an illustrative calculation, not TEEMYEAH project data and not an industry benchmark. It intentionally uses the same menu and operating assumptions for 20, 50 and 100 locations so the effect of network growth is easy to see.
Hypothetical assumptions
- 350 meals or orders per active outlet per planning day
- 160 grams of the modeled prepared ingredient family per applicable meal
- 65% menu occurrence factor
- 1.15 peak-day factor
- 82% raw-to-accepted-output yield
- Production every day
- 10 scheduled production hours
- 1.5 hours reserved for sanitation
- 0.75 hour for SKU changeovers
- 0.5 hour for breaks
- 0.25 hour of planned downtime allowance
- 7.0 net processing hours
- One daily dispatch cycle for the simplified cold-storage calculation
- 8% packaging and WIP storage allowance
The saleable requirement per outlet is:
350 × 0.160 kg × 0.65 × 1.15 = 41.86 kg per outlet per peak planning day
At an assumed 82% yield, raw input per outlet becomes approximately:
41.86 / 0.82 = 51.05 kg
| Illustrative planning value | 20 locations | 50 locations | 100 locations |
|---|---|---|---|
| Meals/orders on planning day | 7,000 | 17,500 | 35,000 |
| Saleable prepared output | 837.2 kg/day | 2,093.0 kg/day | 4,186.0 kg/day |
| Raw input at 82% assumed yield | 1,021.0 kg/day | 2,552.4 kg/day | 5,104.9 kg/day |
| Raw-stage operational rate over 7 net hours | 145.9 kg/h | 364.6 kg/h | 729.3 kg/h |
| Finished-product cold-storage load with 8% WIP/packaging allowance | 904.2 kg | 2,260.4 kg | 4,520.9 kg |
The table makes the arithmetic look linear. Real central-kitchen configuration is not. Doubling outlet demand does not automatically mean that every process stage can simply operate twice as fast. One SKU may create a cutting peak during a narrow morning window. A centrifugal drying step may operate in discrete batches while washing is continuous. RTE production may need separation from raw or RTC work. Packaging may have a later cutoff than vegetable preparation. Cleaning requirements can prevent two product families from using the same equipment back-to-back without an acceptable changeover procedure.
Linear multiplication therefore answers “how many kilograms are required?” It does not prove that one larger line can process the menu within the available schedule.
Convert Daily Kilograms into Stage-by-Stage Throughput
Daily volume becomes useful for equipment selection only after it is translated into the time available at each process stage.
Net processing hours = scheduled hours − sanitation − changeover − breaks − planned downtime
Required stage rate = stage input / available net processing hours
The stage input may differ across the line. Receiving handles the entire incoming raw quantity. A downstream cutter may handle only selected SKUs. A dryer may receive only washed leafy products. A mixer may see a smaller subset again. Using total factory kilograms as the capacity requirement for every machine can substantially overstate some stages while hiding a bottleneck in another.
| Stage | Main sizing question | Capacity/configuration issue | Evidence needed before final selection |
|---|---|---|---|
| Receiving and raw storage | How much raw material arrives, and in how few delivery windows? | Dock peaks, pallet/crate handling and raw cold-room dwell may be more important than hourly line capacity. | Supplier delivery pattern, packaging format, raw temperature and inventory policy |
| Inspection, sorting and trimming | How much product requires manual judgment or defect removal? | Highly variable raw material can make labor the effective capacity constraint. | Representative seasonal raw material and reject criteria |
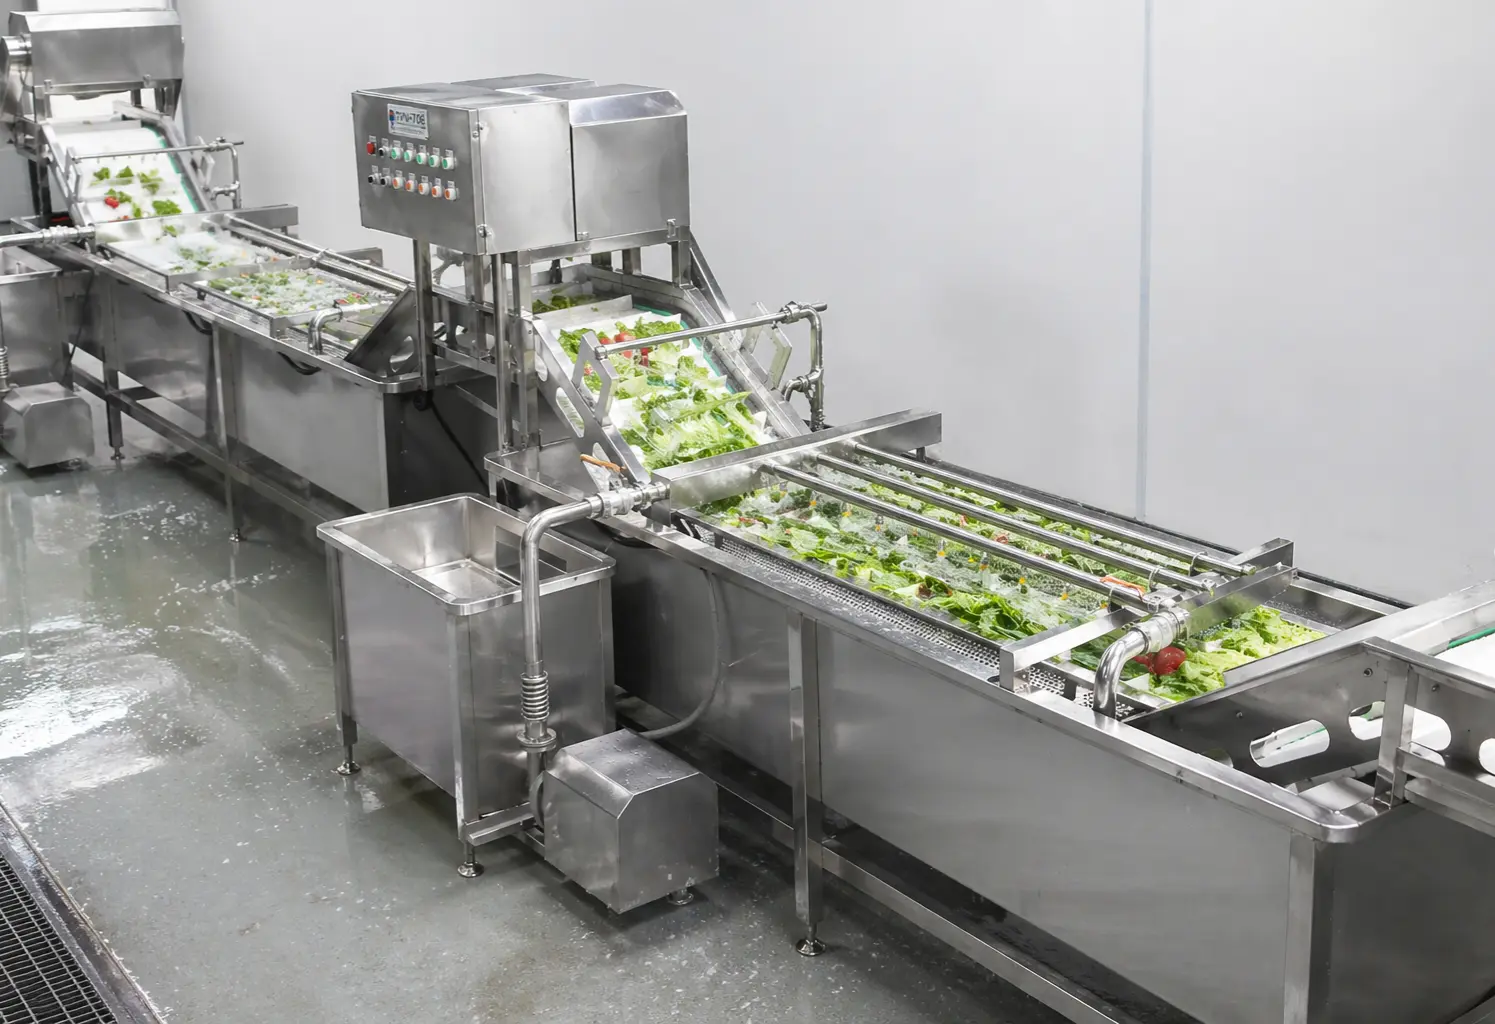
| Washing and process-water stages | Which SKUs share a wash process and which require different treatment? | Continuous throughput must be reconciled with product residence, water management, changeovers and hygiene controls. | Product specification, food-safety plan and test material |
| Cutting, slicing, dicing or shredding | What is the peak load by cut specification rather than total daily kilograms? | Frequent blade or SKU changes can reduce usable hours even when nominal throughput is high. | SKU matrix, dimensions, cut specification and sequence |
| Dewatering or drying | Is the stage continuous or batch-based? | Batch cycle time, loading, unloading and product sensitivity can produce queueing between continuous stages. | Target surface moisture, product type and representative tests |
| Mixing, portioning or downstream handoff | Does downstream demand occur continuously or in scheduled production lots? | Campaign scheduling may create concentrated peaks not visible in daily averages. | Recipes, packaging plan and batch schedule |
| Finished cold storage | How much product accumulates before each dispatch? | Required space depends on dwell time, rack/container format and dispatch sequence, not only kg/day. | Packaging dimensions, route schedule and temperature requirements |
| Sanitation | How much of the calendar is genuinely unavailable for production? | Adding machine capacity cannot recover hours that the food-safety plan requires for cleaning and verification. | Sanitation SOPs, zoning plan and changeover procedures |
A useful second metric is planning utilization. If engineering teams do not want a critical stage to operate at its theoretical maximum for every production hour, they may apply an explicit design utilization factor. For example:
Planning equipment rate = required operational stage rate / selected utilization factor
The utilization factor must be chosen by the project team. It is not a universal percentage. Product variation, cleaning frequency, reliability strategy and future growth all influence how much operating margin is appropriate.
Do Not Treat Sanitation Time as Spare Production Capacity
A ten-hour shift rarely provides ten hours of productive throughput. Cleaning, inspection, product changeovers, employee breaks, startup checks and planned maintenance consume calendar time. When those activities are removed from the capacity model, a seemingly adequate line can become overloaded before the network reaches its target number of outlets.
This matters particularly when exposed RTE products are involved. Mechanical compatibility does not by itself establish that RTC, raw and RTE products should use the same area or equipment. The operator’s food-safety team must evaluate contamination routes, zoning, personnel and utensil movement, cleaning effectiveness, drainage, waste flow, process sequencing and changeover verification.
Codex General Principles of Food Hygiene describe Good Hygiene Practices as the foundation of food hygiene systems and address facility and equipment design, maintenance, cleaning, operational control and transportation. In the United States, FDA’s 21 CFR Part 117 framework also addresses plant design, equipment, sanitary operations and production/process controls for covered human-food facilities, subject to the rule’s scope and exemptions. These frameworks support an important capacity-planning principle: hygiene requirements belong inside the production calendar rather than being treated as work that can always be compressed after processing finishes.
Cold Storage Is a Timing Calculation, Not Just a Daily-Kilogram Calculation
A facility producing 4,000 kg per day does not necessarily require storage for exactly 4,000 kg. Some product may leave while later batches are still being prepared. Conversely, production for the following day, delayed transport or packaging inventory can push peak storage above one day’s finished output.
A simplified planning equation is:
Cold-storage load = product held per dispatch cycle + packaging/WIP allowances
The difficult variable is “product held per dispatch cycle.” If trucks depart once per day after production is complete, much of the day’s output may accumulate before dispatch. If the network supports several route waves, peak accumulation may be materially lower. A regional business may also stage finished product overnight because delivery routes leave before outlets open.
Outlet limitations matter just as much. Increasing delivery batch size may reduce central dispatch frequency but can be irrational if restaurants lack refrigerated storage or if the additional dwell time conflicts with the operator’s product-life and food-safety controls. The FDA Food Code can inform U.S. retail and foodservice temperature-control discussions, but it is a model code intended for adoption or adaptation by jurisdictions, not a universal law. Projects must therefore review the rules that actually apply at the facility and outlet locations.
One Shift, Two Shifts, Parallel Modules or One Larger Integrated Line?
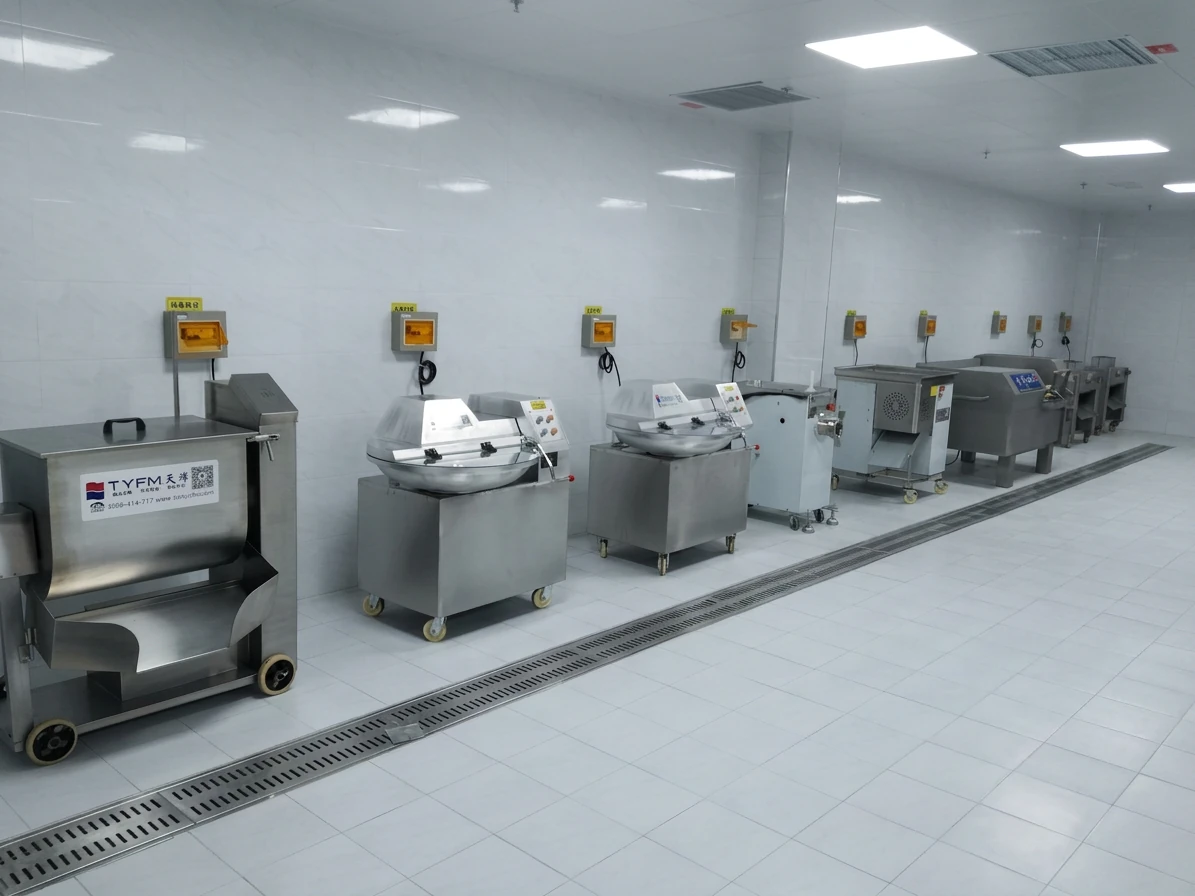
After daily demand and stage loads are understood, the engineering decision shifts from “how big?” to “how should the required capacity be organized?” Four configurations may produce the same theoretical daily kilograms while behaving very differently in operation.
| Configuration | Where it can make sense | Main advantages | Main risks or trade-offs |
|---|---|---|---|
| One normal shift | Demand fits comfortably inside a stable production window with manageable SKU changes. | Simpler supervision, fewer shift handovers and easier schedule visibility. | Peak-day compression can leave little recovery time after delays or raw-material variation. |
| Extended shift or two shifts | Daily kilograms are high but do not need to pass every stage simultaneously. | More usable processing hours without automatically increasing every machine’s nominal rate. | Additional staffing, handovers, sanitation coordination, maintenance access and possibly longer cold-storage dwell. |
| Two or more parallel modules | SKU families differ significantly, redundancy matters, or RTE/RTC separation supports the food-safety design. | Scheduling flexibility, phased growth and the possibility of maintaining partial production during some maintenance events. | More floor area, duplicated equipment, utilities, cleaning effort and integration points. |
| One larger integrated line | High, predictable volume follows a relatively stable process sequence with limited incompatible SKU variation. | Potentially simpler material flow and fewer intermediate transfers. | Greater dependence on the integrated line, less flexibility for divergent products and potentially expensive oversizing during early network growth. |
The correct configuration is often determined by schedule structure rather than maximum hourly throughput. If a 100-location network runs leafy vegetables, root vegetables and several RTE SKUs with distinct sanitation requirements, two smaller process modules may be more operationally useful than one line with a larger theoretical number on its specification sheet.
The opposite can also be true. Duplicating lines purely for redundancy may not be commercially justified when volumes are stable, product families are compatible and maintenance can be planned outside production windows.
Batch Stages Can Break an Apparently Balanced Continuous Line
Food pre-processing lines frequently combine continuous and batch operations. Conveyors, washing systems and inspection belts may operate continuously, while spin drying, mixing, weighing, crate handling or certain preparation tasks operate in cycles.
Consider a continuous upstream process delivering product every minute into a dryer that accepts discrete batches. The relevant calculation is not simply the dryer’s nominal kilograms per hour. Engineers must examine batch size, loading time, cycle time, unloading time, operator availability and buffer capacity between stages. A delay of a few minutes repeated across many cycles can create WIP accumulation even when the arithmetic average looks balanced.
For that reason, stage-capacity verification should include a time-based process map. TEEMYEAH’s guide to food processing equipment capacity verification addresses the broader distinction between stated machine capacity and sustained operating capacity. For a restaurant-chain central facility, that verification should be applied to the exact SKU sequence used in the outlet-to-capacity model.
SKU Peaks Matter More Than a Blended Daily Average
A restaurant chain may consume 2,000 kg of prepared vegetables per day while needing 700 kg of one cut specification within a short morning window. The average hourly requirement can therefore conceal a cutting or drying bottleneck.
A useful planning extension is to create a matrix with SKUs in rows and production windows in columns. Record each SKU’s raw input, yield, relevant process stages, changeover family and required completion time. The engineering team can then identify which stages experience simultaneous load.
This is also where menu simplification and production sequencing become capacity tools. Adding a larger cutter will not necessarily solve a schedule in which incompatible products repeatedly force cleaning and blade changes. Sometimes the lower-cost capacity intervention is to regroup SKUs, revise campaign sizes or move selected preparation back to outlets.
For a deeper SKU-and-shift calculation framework, the related central kitchen capacity calculation by SKU, shift and peak demand can be used alongside this network-sizing model.
Labor Capacity Should Be Modeled Alongside Machine Capacity
A stage does not have usable capacity if trained operators are unavailable to load, inspect, unload, clean or verify it. This is particularly relevant for sorting, trimming and irregular raw materials where human judgment may remain more practical than extensive automation.
U.S. Bureau of Labor Statistics Occupational Requirements Survey data for 2025 illustrates the broader labor context: within the U.S. food preparation and serving occupational group, work schedules varied for 78.8% of workers, on-the-job training was required for 95.6%, and workers spent an average 97.2% of the workday standing. These figures cover a broad U.S. occupational category rather than central-kitchen processing employees, so they should not be used as a staffing assumption for another country or a specific facility. They do, however, show why local schedule stability, training burden and ergonomics deserve explicit evaluation.
Useful internal labor metrics include labor hours per 1,000 kg, kilograms handled per labor hour at labor-dependent stages, overtime caused by peak days, absence coverage, training time, and the proportion of work involving repetitive lifting, carrying or trimming.
Automation is most valuable when it solves a defined constraint. A manual process can remain rational when volumes are small, SKUs change frequently, ingredients are irregular and the labor task requires judgment that equipment would not simplify. Semi-automation can be more appropriate when washing or conveying is repetitive but inspection and trimming still require flexibility. A more integrated line becomes easier to justify when volume is sustained, process steps are repeatable and upstream and downstream stages can be balanced.
Plan Capacity for Yield Variability, Not One Perfect Raw Material
Raw-material condition can change the amount of product that must enter the facility to achieve the same accepted output. Size, maturity, soil, damage, trimming requirements and supplier specification all influence practical yield.
If the model assumes 82% yield but a seasonal supply condition produces only 75% under the operator’s actual acceptance specification, raw-material demand and upstream stage load rise even though restaurant sales have not changed. That can create shortages in receiving, washing and trimming before the downstream line reaches its nominal capacity.
For planning purposes, operators can model normal, unfavorable and exceptional yield scenarios. The objective is not to make every machine large enough for the worst theoretical condition. It is to understand what the network will do when the assumption changes: buy more raw material, extend production, schedule another campaign, accept a different specification or use alternate supply.
Representative raw-material testing is therefore part of final capacity verification. Tests should use defined input condition, target output specification and actual process sequence rather than a convenient demonstration product.
Capacity Expansion Should Be Modeled Before It Is Purchased
Restaurant groups often know that more locations are planned even when the exact opening calendar is uncertain. That uncertainty does not require building the full future factory immediately.
A better approach is to model at least three network states: current committed demand, near-term approved expansion and a longer-range scenario. For each state, identify which constraints change first. Receiving space may reach its limit before the washing line. Cold storage may become critical before cutting. An additional shift may postpone the need for a second process module.
This creates a phased automation plan rather than a single oversized purchase. Utility connections, drainage, floor space and controls can sometimes be planned for future expansion while equipment is installed according to validated demand.
Growth buffer should also be separated from operational buffer. Operational margin covers normal variation, planned downtime and uncertainty. Growth capacity exists for future outlets. Combining both into one vague “30% extra” factor makes later decisions difficult to audit.
When a Central Preparation Facility Is Premature
Centralization is not automatically the correct answer for every restaurant network. A central facility may be premature when total preparation demand is low, menus differ heavily between locations, outlets already possess sufficient skilled labor and workspace, or transport distances create more complexity than central processing removes.
Local preparation can remain rational when ingredients are highly perishable after processing, recipes depend on last-minute preparation, volumes are too fragmented to form efficient central campaigns, or outlets have enough receiving and preparation capability to perform the task consistently.
A regional-hub model can be more rational when outlets cover a wide geography. Instead of sending all prepared product from one large central kitchen, smaller hubs may reduce route length and finished-product dwell while still centralizing selected tasks.
The relevant comparison is therefore not “manual versus automated factory.” It is the total operating model: procurement, raw-material transport, preparation, yield, labor, sanitation, packaging, cold storage, distribution, outlet labor and waste.
The related discussion of centralized ingredient preparation for restaurant chains and decentralized outlet preparation can help frame that operating-model decision before a facility configuration is finalized.
When Two Smaller Lines Are Better Than One Large Line
Two smaller modules can be preferable when the network needs different product families at the same time, when cleaning requirements make sequential production inefficient, when RTE and RTC responsibilities support physical or operational separation, or when partial redundancy has meaningful business value.
The strongest argument is usually scheduling flexibility. One module might process leafy products while another handles root vegetables. One can undergo cleaning or maintenance while the other remains available for compatible production. Future growth can also be added in steps.
That flexibility has a cost. Multiple modules can require more floor area, operators, controls, utilities, spares and sanitation resources. The decision should therefore be made from the SKU schedule and risk model, not from a general belief that redundancy is always safer.
Why Extra Nominal Capacity Cannot Fix a Poor Operating Model
Oversizing equipment is sometimes treated as insurance against uncertainty. It can provide useful margin, but it cannot repair fundamental planning problems.
- Extra throughput does not correct inaccurate outlet forecasts.
- A larger washer does not resolve poor SKU sequencing.
- More cutting capacity does not recover yield lost through unsuitable trimming specifications.
- A faster line does not replace hygienic zoning or an effective food-safety plan.
- Higher production capacity does not create additional outlet refrigeration.
- More equipment does not remove cold-chain or dispatch constraints.
- A larger nameplate rating cannot eliminate cleaning, maintenance or changeover time.
Capacity is therefore an attribute of the whole operating system. The engineering target is sustained, schedulable output that reaches the correct specification and dispatch window—not the highest instantaneous machine rate.
From Capacity Model to Equipment Configuration
Once outlet demand, stage loads and production windows are documented, equipment discussions become substantially more precise. Instead of asking suppliers for a generic 500 kg/h or 1,000 kg/h line, the project team can specify the raw products, target cuts, daily volumes, SKU peaks, required completion times, cleaning windows and intended process responsibility.
For projects involving several ingredient families, TEEMYEAH’s custom food pre-processing line framework can be used to discuss how individual process modules connect rather than assuming that one standard line applies to every menu. Restaurant-chain teams can also use the broader restaurant chain and QSR processing framework to determine which preparation responsibilities belong centrally and which should remain at outlet level.
Final equipment decisions should be based on representative product trials where relevant. The purpose is to check product handling, cut specification, process sequence, sustained capacity and upstream/downstream compatibility under conditions that resemble the intended operation.
Use the Model as an Engineering Brief, Not a Guaranteed Quotation
An outlet-to-capacity model narrows the engineering problem, but it does not validate a final factory design. A supplier still needs enough technical evidence to confirm how the proposed process behaves with the operator’s actual product mix.
Final equipment and facility design may require representative raw-material tests, SKU and finished-product specifications, layout and utility review, local regulatory review, alignment with the operator’s food-safety plan, packaging and logistics information, and sustained-capacity testing. Building and food regulations vary by country and jurisdiction; no international guideline should be treated as a substitute for the requirements that apply to the specific site.
The model should also be updated after commissioning. Actual yield, changeover time, downtime, outlet demand and dispatch performance provide better inputs than the assumptions available during concept development.
CTA: Estimate Capacity for Your Outlet Network
If your restaurant, QSR, catering or foodservice network is evaluating centralized preparation, begin with the demand model rather than a machine list. TEEMYEAH can review your active and planned outlet count, order volumes, standardized recipes, ingredient families, raw-material condition, target product specifications, yield information, production windows, dispatch schedule, layout and utilities to discuss a preliminary process configuration and capacity match. Where product behavior is uncertain, representative testing can be incorporated before the equipment concept is finalized.
FAQ
1. How do I calculate central kitchen capacity for restaurant chain growth?
Start with expected outlet demand and convert it into kilograms of accepted product. Multiply active locations by meals or orders per location, ingredient grams per applicable meal, the menu occurrence factor and a peak-day factor. Divide that saleable output by the expected processing yield to estimate raw input. The calculation should then be repeated by SKU and process stage. Planned outlet growth should be modeled as a separate future scenario rather than hidden inside an arbitrary capacity buffer, because different stages may become bottlenecks at different network sizes.
2. How much central kitchen capacity is needed for 20 restaurants?
There is no standard capacity associated with 20 locations. Twenty high-volume restaurants with substantial centrally prepared ingredients may require more production than 50 smaller outlets with limited central preparation. Use POS volume, standardized portion weights, menu occurrence and peak-day demand to calculate required saleable kilograms. Then account for raw-to-finished yield and the actual net production window. Outlet storage and delivery frequency also matter: a relatively modest daily volume can still require significant cold storage if all product must be completed before one dispatch wave.
3. Can I estimate a 50- or 100-location facility by multiplying a 20-location model?
Linear multiplication is useful for a first demand scenario when menu mix, portions and outlet volumes are intentionally held constant. It does not prove that the same equipment architecture will scale linearly. Larger networks can expose SKU peaks, batch-stage bottlenecks, sanitation conflicts, cold-storage constraints and dispatch timing that are insignificant at smaller volumes. A 100-location scenario should therefore be recalculated stage by stage and by production window, even when its initial daily-kilogram estimate is five times the 20-location case.
4. Should central kitchen capacity be based on average demand or peak demand?
Average demand is useful for annual purchasing, labor budgeting and utilization analysis, but design capacity normally needs a defined planning peak. That peak should come from actual or forecast demand patterns rather than an unexplained safety factor. Operators may model normal weekdays, peak weekdays, seasonal events and promotional periods separately. The facility does not necessarily need enough installed equipment for the most extreme theoretical day; the important decision is how exceptional demand will be handled through inventory, schedule extension, extra shifts, alternative sourcing or temporary local preparation.
5. How should yield be included in a central kitchen capacity calculation?
Yield converts the accepted output required by outlets into the amount of raw material the facility must receive and process. If 1,000 kg of accepted product is required and the verified process yield is 80%, raw input would be 1,250 kg. Yield should be measured for the operator’s raw materials, specifications and process rather than copied from unrelated facilities. Seasonal quality, trimming standards, supplier variation and preparation method can change the result. Where variation is significant, model several yield scenarios and verify them through documented production trials.
6. Is one large processing line better than two smaller lines?
Not necessarily. One larger integrated line may suit a high-volume, predictable product family with a stable sequence and limited changeovers. Two smaller modules can offer more flexibility when SKU families need simultaneous production, when RTE and RTC operations need different controls, when cleaning interrupts production or when partial redundancy is valuable. Parallel lines also support phased growth, but they require additional space, utilities, operators and sanitation resources. The comparison should be based on the production schedule, hygiene design, maintenance strategy and total lifecycle cost rather than nameplate throughput alone.
7. How many production hours should be used when sizing a central kitchen?
Use net processing hours, not the total hours employees are scheduled to be present. Subtract sanitation, product changeovers, breaks, startup checks and planned downtime from the scheduled production period. Some stages may have different available windows: receiving may begin earlier, cutting may finish before packing, and sanitation may prevent RTE equipment from operating during other campaigns. If the resulting rate is too high for a practical one-shift configuration, compare an extended shift, a second shift, parallel modules or revised production sequencing before simply specifying larger equipment.
8. How should cold-room capacity be calculated for a restaurant-chain central kitchen?
Cold-room sizing should reflect peak inventory held at one time rather than daily production alone. Map when each batch enters storage, when packaging or WIP is accumulated and when each dispatch wave departs. Frequent deliveries can reduce finished-product accumulation, while overnight production or one daily route departure can increase it. Packaging dimensions, pallet or crate configuration and required airflow also affect usable space. Outlet refrigeration capacity must be checked simultaneously, because shifting additional inventory downstream is not a valid solution if restaurants cannot safely receive or store it.
9. When should food preparation remain at individual restaurant locations?
Local preparation can remain rational when central volumes are low, menus differ significantly between sites, preparation must occur immediately before service, transport would add excessive cold-chain complexity, or restaurants already have suitable labor and preparation space. A regional-hub model may also be more practical for geographically dispersed networks. Centralization should be evaluated against the complete operating system—including procurement, yield, labor, packaging, storage, logistics and outlet handling—rather than assuming that removing preparation from restaurants automatically reduces total cost or risk.
10. What information should I give an equipment supplier after the capacity model is complete?
Provide the outlet demand model together with representative raw materials, SKU list, raw and finished-product specifications, cut dimensions, measured or assumed yields, required daily output, peak production windows, shift plan, sanitation and changeover requirements, RTE or RTC responsibility, packaging method, dispatch schedule and expected future growth. Layout drawings and available utilities should also be reviewed. This turns a capacity estimate into an engineering brief. Final configuration still requires product testing where relevant, facility and regulatory review, food-safety-plan alignment and verification of sustained operating capacity.
Data and Source Note
USDA Food and Nutrition Service — Food Buying Guide for Child Nutrition Programs. The guide provides methods for relating servings, edible portions and purchase quantities and explains that yield is affected by product condition, storage, preparation equipment and method. Its formal scope is U.S. Child Nutrition Programs. The planning logic is referenced here as an example of portion-to-purchase conversion; USDA example yields are not presented as universal commercial processing yields.
U.S. Food and Drug Administration — Current Good Manufacturing Practices for Food and Dietary Supplements / 21 CFR Part 117. FDA explains that the framework addresses areas including plant design, equipment, sanitary operations and production/process controls. The regulation applies within its U.S. legal scope and includes exemptions and food-category-specific requirements. It is not presented here as a global regulatory standard.
U.S. Food and Drug Administration — Food Code 2022. The Food Code provides a model framework for retail and foodservice safety and is offered for adoption or adaptation by governmental jurisdictions. It is referenced for the principle that temperature control and foodservice handling requirements can affect storage and distribution planning. It is not a universally applicable global law.
FAO/WHO Codex Alimentarius — General Principles of Food Hygiene, CXC 1-1969, 2023 publication incorporating the 2022 revision. Codex identifies Good Hygiene Practices as the foundation of food hygiene systems and covers facility and equipment design, maintenance, cleaning, operational control, transportation and HACCP principles. Application still requires the food business operator to evaluate its products, hazards and local regulatory obligations.
U.S. Bureau of Labor Statistics — Occupational Requirements Survey, Food Preparation and Serving Related Occupations, 2025. The cited U.S. occupational group reported variable work schedules for 78.8% of workers, on-the-job training requirements for 95.6%, and an average 97.2% of the workday spent standing. These are broad U.S. occupational statistics covering multiple foodservice roles. They are used only to illustrate why staffing, training and ergonomic assumptions should be measured locally rather than applied as central-kitchen benchmarks.
Model limitation. All 20-, 50- and 100-location calculations in this article are hypothetical planning scenarios created to demonstrate the sizing method. They are not TEEMYEAH customer data, equipment ratings, guaranteed throughput, regulatory validation or a quotation. Final engineering decisions require project-specific evidence.

