
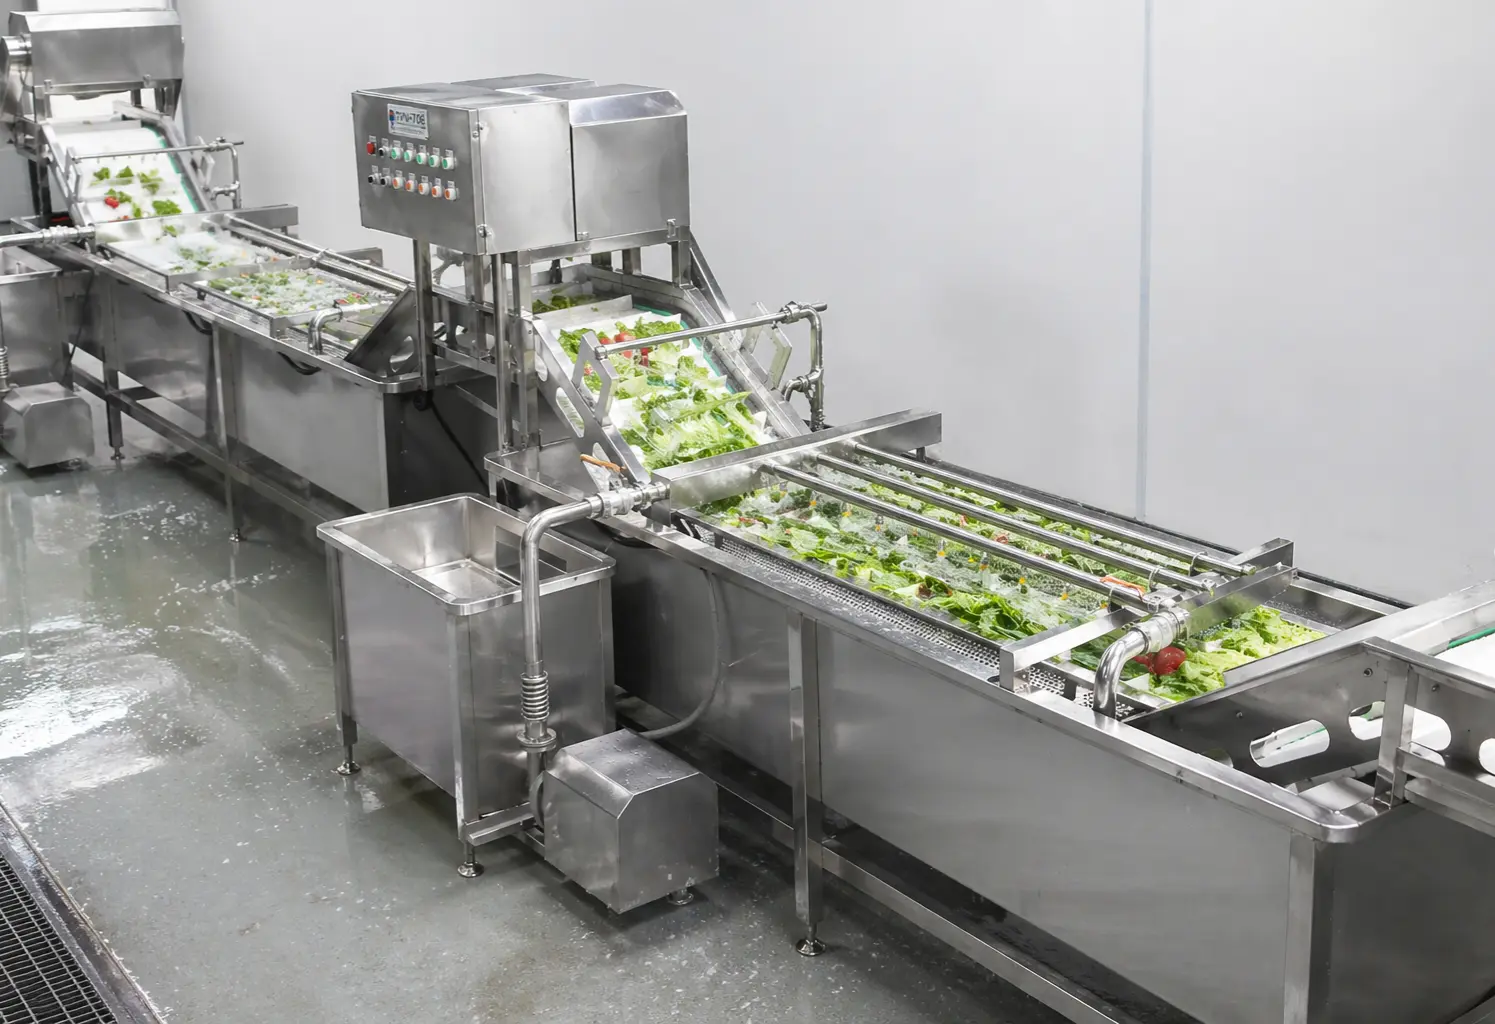


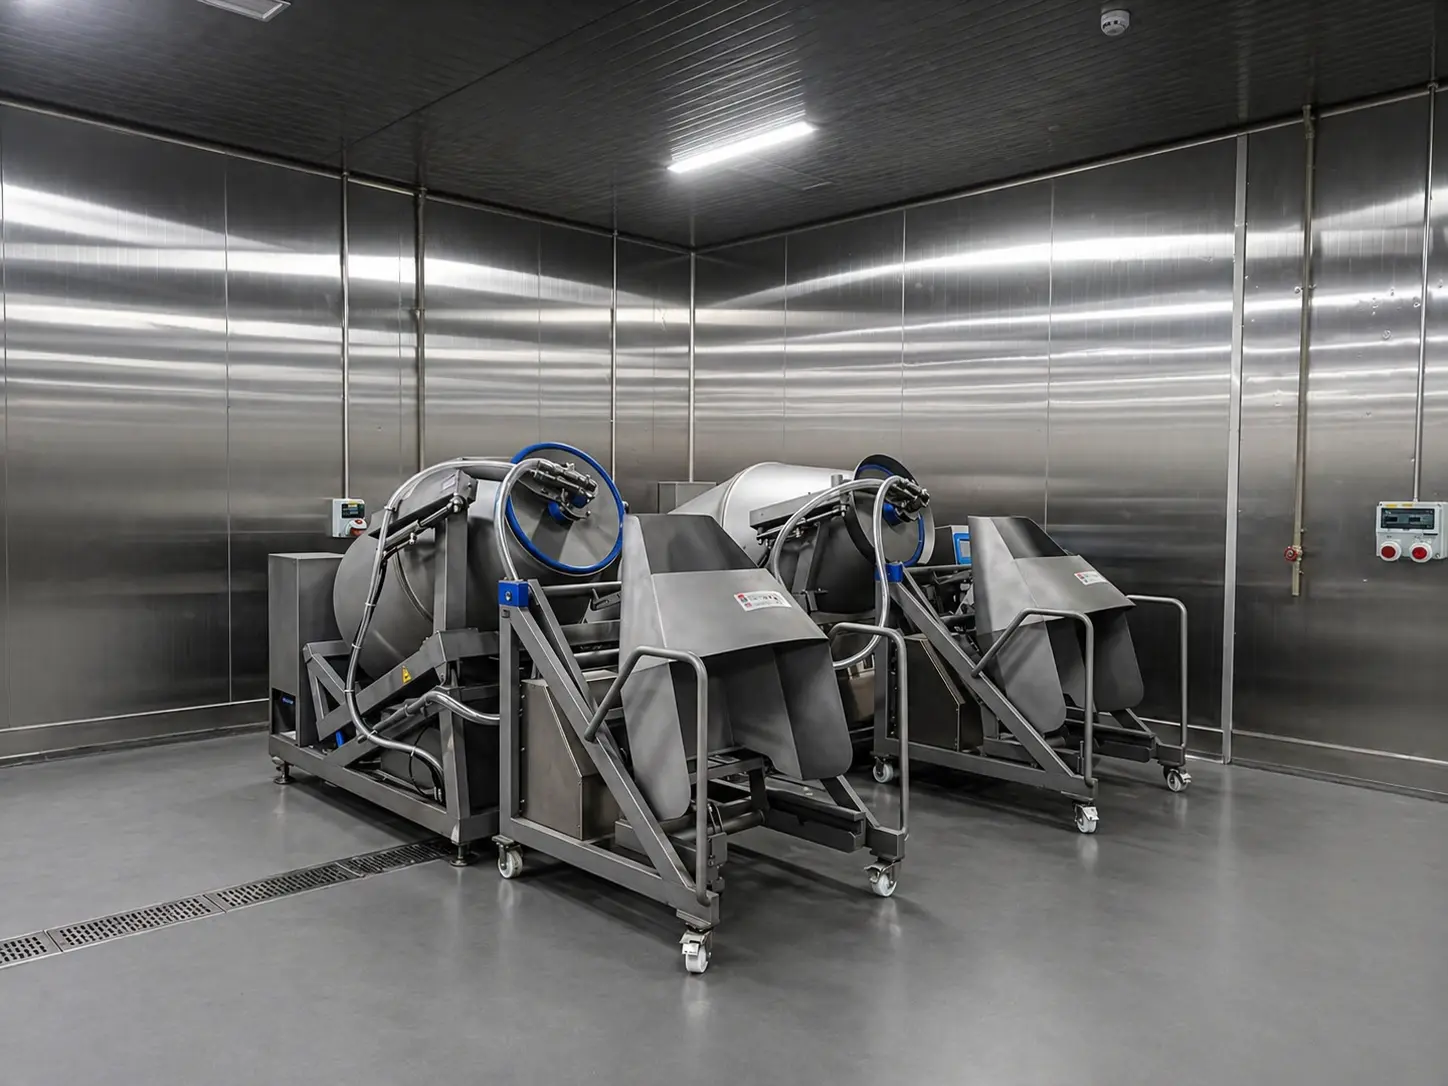


Summary
The food preparation process you should automate first is not necessarily the operation with the highest labor count, the newest available machine or the most visible queue. It should be the process that persistently constrains usable output, creates measurable labor or quality losses, carries significant food-safety or ergonomic exposure, and can be improved without simply moving the bottleneck downstream.
This article introduces an Automation Priority Score for comparing washing, sorting, trimming, peeling, cutting, dewatering, mixing, conveying and related food pre-processing steps. The score combines seven weighted factors: throughput constraint, labor and ergonomic burden, yield and quality variation, food-safety control significance, SKU and changeover suitability, integration readiness, and commercial justification.
The method begins with several representative production runs rather than equipment catalog capacities. Managers record actual good output, labor hours, waiting time, work-in-process accumulation, yield, rejects, changeover time, sanitation time and unplanned stops. Each process is then scored against the same criteria.
A high score does not automatically justify a fully integrated line. Phase gates determine whether the appropriate response is manual process improvement, targeted semi-automation or broader line integration. Product testing, hygienic design review, downstream capacity, maintenance capability and realistic economics must all be confirmed before investment.
The Most Labor-Intensive Step Is Not Always the First Step to Automate
A central kitchen may have eight people trimming vegetables while only two operate the cutting area. It is tempting to conclude that trimming should be automated first. Yet the cutting station may still be the true production constraint if it regularly stops the washing process, creates a growing buffer of prepared raw material and prevents packing from meeting dispatch time.
Another facility may have a high-capacity vegetable cutter but still miss daily production targets. Investigation shows that operators spend much of the shift waiting for washed product, changing blades between SKUs or moving wet ingredients in bins. Buying a faster cutter would increase nominal capacity without increasing finished output.
This is the central question behind which food process to automate first: where will automation create the greatest verified improvement in the performance of the complete process?
The answer requires a different analysis from deciding whether a facility is broadly ready for automation. Businesses still considering that broader question can review when a central kitchen should automate food preparation. Facilities already struggling with disconnected equipment and capacity imbalance may also need to examine why adding more machines does not automatically remove production bottlenecks.
Here, the working assumption is that management is already considering an equipment or process upgrade. The task is to rank the candidate operations and choose the most defensible starting point.
How to Decide Which Food Process to Automate First
The first automation project should normally address a process that meets four conditions:
- It causes a persistent, measurable operational loss.
- The loss remains after basic manual improvements have been attempted.
- A technically suitable solution can handle the actual product range.
- The surrounding process can absorb the improvement.
A bottleneck is not simply a station where employees look busy. It is the process that limits the rate at which acceptable finished product can pass through the system during the period being evaluated.
That qualification matters. A washing station might constrain output during the morning lettuce run but not during afternoon carrot processing. Manual trimming may constrain production during seasonal raw-material variation. Packing may become the limiting step only when several SKUs converge near the end of a shift.
The priority assessment must therefore consider product mix, time window and operating conditions. A single average for the entire month can hide the constraint that appears during the highest-volume SKU, the most difficult raw material or the busiest dispatch period.
Separate nominal capacity from actual usable throughput
Equipment suppliers usually state capacity under defined product and operating conditions. Actual throughput is the quantity of acceptable product produced per unit of operating time in the buyer’s real process.
For practical measurement:
Actual throughput = acceptable output quantity ÷ actual operating time
Operating time should exclude planned breaks if the process is not expected to run during them, but it should not conceal operational losses such as product starvation, minor stops, blockages, cleaning interruptions or unplanned blade changes.
A cutter rated for 1,000 kilograms per hour may deliver far less usable output when operators must manually feed irregular vegetables, remove unsuitable raw material, change specifications repeatedly or wait for washed product. Conversely, a lower-capacity machine may meet the line target reliably because it handles the required SKU range with fewer interruptions.
Find persistent queues, starvation and blocked flow
Work-in-process, or WIP, provides visible evidence of imbalance.
A queue before a station suggests that the station cannot keep pace with its incoming load. Repeated idle time after a station may indicate that the downstream process is being starved. Operators may compensate by producing large batches, using temporary containers or starting certain processes earlier, but these workarounds often conceal the original capacity problem.
Record where product waits, how much accumulates and how long it remains there. The measurement should include:
- Raw material waiting before processing
- Cut product waiting before washing
- Washed product waiting before dewatering
- Dewatered ingredients waiting for mixing or packing
- Empty time when a process has no incoming product
- Time lost while workers search for containers, tools or labels
- Product rehandled because the planned transfer route is unavailable
The largest pile is not always the most important queue. Consider whether the accumulation affects temperature control, product damage, sanitation, traceability, allergen separation or dispatch timing.
Build a Measurement Baseline Before Scoring Automation Priorities
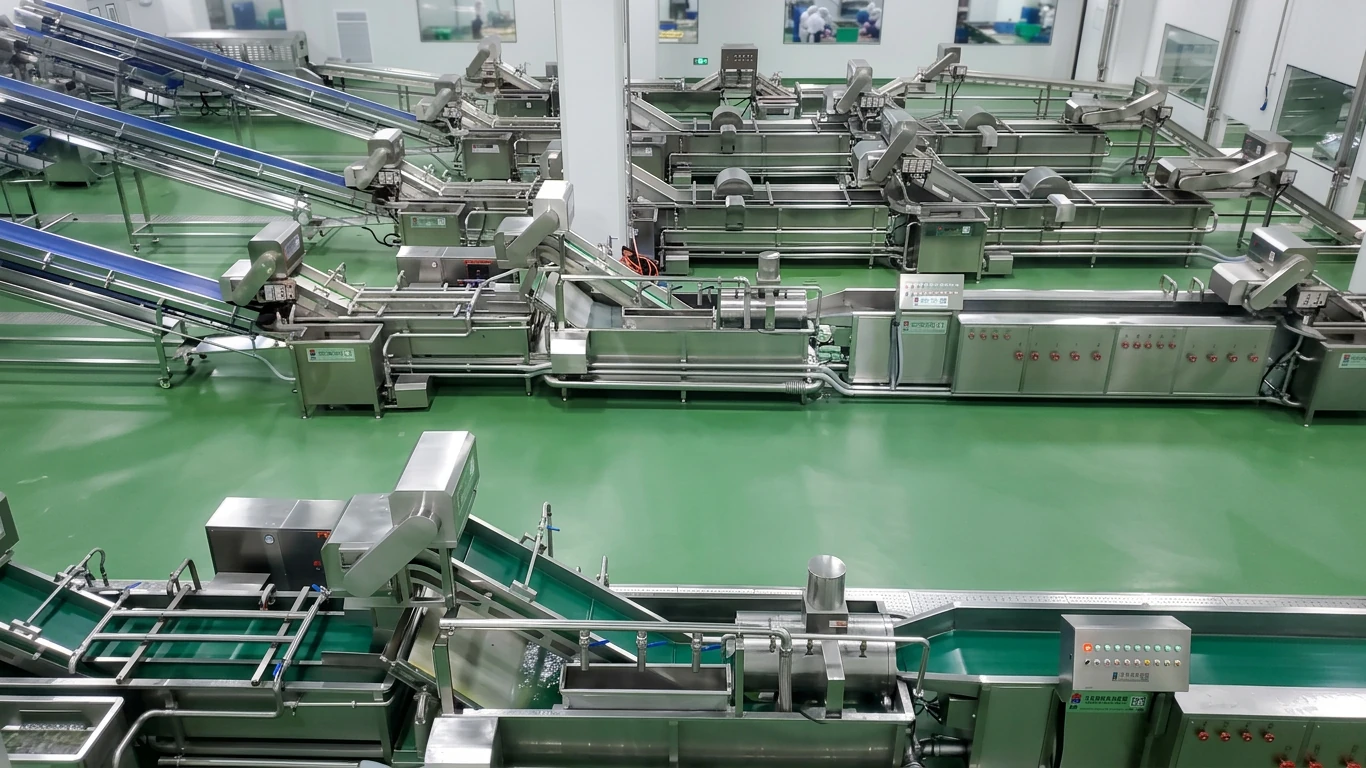
A purchasing decision should not be based only on supervisor impressions or one unusually difficult shift. Collect data over representative production conditions.
For a relatively stable operation, five to ten representative production days may provide an initial baseline. A facility with strong seasonal variation, frequent menu changes or several raw-material grades may require a longer measurement period. The correct duration depends on whether the observations capture normal volume, peak volume, difficult products, major SKU families and common staffing conditions.
The period is a management choice, not a regulatory requirement. The aim is to obtain enough evidence to distinguish a repeating constraint from a temporary disruption.
Food Preparation Process Measurement Worksheet
| Measurement field | What to record for each process step | Practical calculation or observation |
|---|---|---|
| Input quantity | Kilograms or units entering the step | Weighed input by batch, SKU and shift |
| Acceptable output | Product meeting the next process specification | Exclude rejected, reworked or unusable output |
| Actual operating time | Time actively available for processing | Record minor stops and waiting separately |
| Actual throughput | Acceptable output per hour | Acceptable output ÷ operating hours |
| Labor input | Direct and supporting labor hours | Total person-hours ÷ acceptable output |
| Labor hours per 1,000 kg | Normalized labor dependence | Person-hours ÷ output kg × 1,000 |
| Output yield | Acceptable output relative to input | Acceptable output ÷ input × 100 |
| Quality loss | Over-trimming, breakage, incorrect cut, bruising or rejected product | Quantity and reason by SKU |
| Waiting time | Time product spends before and after the step | Minutes per batch or average WIP duration |
| WIP accumulation | Maximum and typical product waiting | Kilograms, containers or batches |
| Changeover time | Time from last acceptable unit of one SKU to first acceptable unit of the next | Include tool, recipe and cleaning changes |
| Sanitation time | Labor and elapsed time needed to clean and release the process | Separate routine and allergen-related cleaning |
| Unplanned downtime | Stops caused by failure, blockage, adjustment or missing resources | Minutes and cause code |
| On-time completion | Whether the process supports the production and dispatch plan | Orders or batches completed on schedule |
| Food-safety control | Hazard, preventive control, monitoring or sanitation significance | Review with the food-safety team |
| Ergonomic exposure | Repetition, force, awkward posture, lifting or prolonged standing | Task observation and worker feedback |
| Traceability gap | Missing batch identity, time record or process record | Frequency and operational consequence |
The worksheet should be completed by people who understand production, quality, sanitation and maintenance. An operator may identify feeding difficulty that is not visible in a management report. The sanitation team may reject an equipment concept that looks productive but cannot be cleaned within the available window.
Use a small set of decision KPIs
Manufacturing references published by the U.S. National Institute of Standards and Technology identify throughput rate, output yield, equipment availability, unplanned stops, capacity utilization and unit cost among possible manufacturing performance indicators. Another NIST manufacturing report discusses measures such as worker efficiency, first-pass yield, scrap, rework and maintenance performance.
These NIST publications are general manufacturing references. They do not create food-industry regulatory requirements. Their value here is methodological: automation priorities should be based on several connected indicators rather than one isolated number.
For food preparation, a practical management set may include:
- Acceptable throughput per hour
- Labor hours per 1,000 kilograms
- Output yield percentage
- First-pass acceptance percentage
- Unplanned downtime percentage
- Changeover and sanitation minutes
- WIP waiting time
- On-time batch completion
- Preparation cost per acceptable kilogram
Avoid creating a dashboard with dozens of metrics that no one uses. Select the measures that explain whether the process constrains output, creates avoidable loss or introduces operational risk.
The Automation Priority Score
The Automation Priority Score is a weighted management tool for comparing several processes under the same production objective. It is not a regulatory model, guaranteed ROI calculation or replacement for a hazard analysis.
Score each candidate process from 1 to 5 against the seven criteria below. A rating of 1 represents low priority or weak automation fit; 5 represents severe impact or strong fit.
Weighted Automation Priority Scoring Table
| Criterion | Weight | Rating 1 | Rating 3 | Rating 5 |
|---|---|---|---|---|
| Throughput constraint and WIP impact | 25% | Keeps pace with demand; no persistent queue | Periodic constraint during selected runs | Repeatedly limits acceptable line output or dispatch |
| Labor dependence and ergonomic burden | 15% | Low labor input and limited repetitive handling | Moderate staffing, lifting or repetitive work | High labor hours, difficult recruitment, repetition, force or awkward handling |
| Yield and quality variation | 15% | Stable yield and specification | Noticeable operator or batch variation | Significant over-trimming, damage, rework, incorrect size or inconsistent result |
| Food-safety and control significance | 20% | Limited direct impact when properly managed | Important sanitation, separation or monitoring role | Critical exposure point, high hygiene sensitivity or significant control-record requirement |
| SKU and changeover suitability | 10% | Highly variable products with no proven equipment fit | Major SKU families can be grouped | Stable product family, repeatable specifications and manageable changeovers |
| Integration and technical readiness | 10% | Downstream cannot accept more output; utilities or layout unsuitable | Some modifications or buffers required | Adjacent capacity, layout, utilities, cleaning access and maintenance support are ready |
| Commercial and strategic justification | 5% | Demand uncertain and loss financially minor | Moderate recurring cost or growth pressure | Confirmed demand, material recurring loss or customer requirement |
Scoring formula
For each criterion:
Weighted criterion score = rating ÷ 5 × criterion weight
The total Automation Priority Score is the sum of all weighted criterion scores.
The maximum score is 100.
A score can prioritize comparison, but it must not be interpreted without the underlying evidence. Two processes may both score 75 while requiring very different actions. One may be suited to a standalone machine; the other may require a redesign of several connected stages.
Suggested interpretation bands
| Automation Priority Score | Initial interpretation | Likely next action |
|---|---|---|
| 0–39 | Low automation priority | Improve work method, scheduling, tools, layout or standards |
| 40–59 | Investigate before purchasing | Run a focused improvement project and gather stronger data |
| 60–74 | Candidate for targeted automation | Conduct product testing and assess semi-automated equipment |
| 75–100 | High-priority automation candidate | Develop a validated equipment or integrated process concept |
These thresholds are proposed decision rules, not industry standards. Management may adjust the weights where food-safety exposure, labor scarcity, customer specifications or strategic capacity has greater importance.
Apply the Score to Real Food Preparation Processes
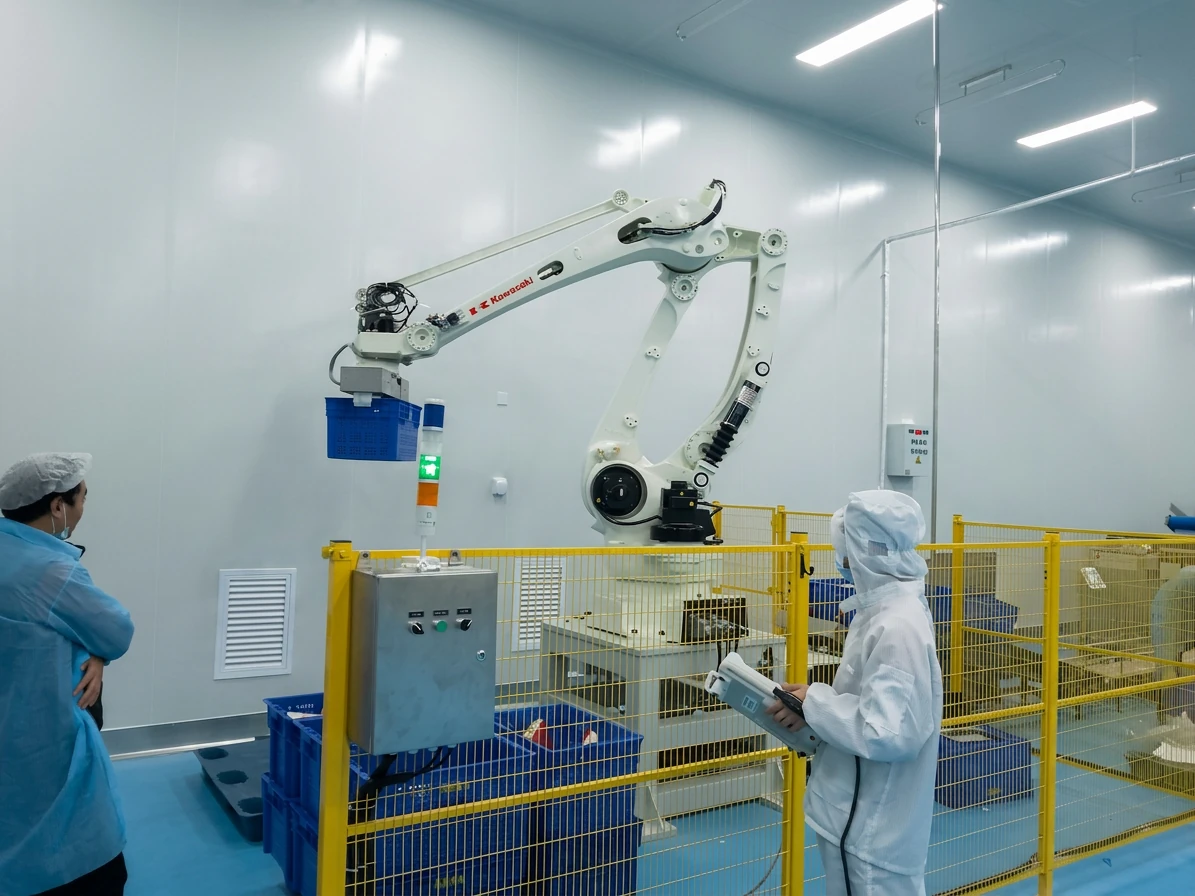
The same scoring framework can be used across operations, but the evidence behind each score will differ.
Sorting and trimming
Manual sorting and trimming remain valuable where raw materials vary greatly in shape, maturity, damage or contamination. Experienced workers can make judgment-based decisions that are difficult to reproduce with a fixed mechanical process.
Automation becomes more attractive when:
- Inspection criteria can be clearly defined
- A major SKU family has a repeatable trimming requirement
- Over-trimming causes measurable yield loss
- The task consumes substantial labor hours
- Repetitive knife work creates ergonomic concerns
- The upstream receiving process can provide a more uniform feed
A low score may indicate that the real problem is purchasing specification, supplier inconsistency or inadequate raw-material grading. Automating the trimming station would not correct those upstream causes.
Peeling
Peeling can become a priority where manual labor is high and over-peeling reduces usable yield. Yet raw-material size, skin condition, surface irregularity and desired finish influence machine performance.
A product test should compare more than kilograms per hour. Measure:
- Peeling completeness
- Flesh loss
- Damage and breakage
- Rework requirement
- Water or abrasive-media use
- Cleaning time
- Performance across the smallest, largest and most irregular raw materials
An automated peeler with high nominal output may be commercially unattractive if it removes too much saleable product or requires extensive manual finishing.
Washing and sanitation-related processes
Washing is often considered for automation because it affects throughput, handling, water management and product cleanliness. The selection cannot be based on tank size alone.
Leafy vegetables, root crops, whole fruits and cut products respond differently to agitation, spraying, flotation and residence time. The sequence may also differ between ready-to-cook products that will receive a later cooking step and ready-to-eat fresh-cut products intended for consumption without further cooking.
Where the U.S. FDA Preventive Controls for Human Food rule applies, covered facilities generally need a written food-safety plan that includes hazard analysis and risk-based preventive controls when required. The FDA also distinguishes legally binding regulatory requirements from its draft, non-binding preventive-controls guidance.
Automation can support controlled parameters, monitoring and repeatability. It cannot, by itself, establish that the process is safe or that a control is validated. Equipment must fit the facility’s hazard analysis, sanitation program, monitoring procedures, corrective-action system and records.
Cutting, slicing and dicing
Cutting is often a strong candidate because it can simultaneously affect throughput, labor, cut consistency, cooking performance, portion accuracy and downstream washing or packing.
A meaningful cutting evaluation should include:
- Actual product range
- Minimum and maximum raw-material dimensions
- Required slice, strip, shred or dice specification
- Acceptable dimensional variation
- Product breakage and compression
- Tool-change procedure
- Cleaning access
- Blade inspection and replacement
- Feed orientation requirements
- Ability to handle the required hourly SKU sequence
A cutter should not be prioritized merely because manual cutting is slow. Its output must be compatible with washing, dewatering, inspection, mixing and packing capacity.
Dewatering and surface-moisture control
Dewatering may become the practical bottleneck after washing capacity increases. Excess surface water can affect package appearance, weight control, dressing dilution and downstream handling.
The process is highly product-dependent. Delicate leaves, shredded vegetables and firm root crops may require different loading, cycle and discharge conditions. The evaluation should record acceptable output rather than assuming the fastest cycle is best.
Where dewatering produces product faster than inspection or packing can receive it, larger buffers may appear. The preferred concept may therefore involve controlled batch discharge, synchronized transfer or a measured intermediate buffer rather than maximum machine speed.
Mixing, blending and seasoning
Mixing is a suitable early automation candidate when recipes are stable, batch records matter and manual distribution produces measurable inconsistency. It is less suitable when the product range is highly variable, batches are very small or delicate ingredients are easily damaged.
The assessment should include:
- Batch size range
- Recipe frequency
- Ingredient addition sequence
- Mixing uniformity
- Product damage
- Allergen controls
- Cleaning and verification time
- Batch traceability
- Discharge and transfer method
A large mixer may reduce direct labor while increasing cleaning time, minimum batch size and production inflexibility. The net effect must be measured across the complete shift.
Conveying and manual transfer
Manual transfer is sometimes ignored because it is not considered a “processing step.” It can still be the first activity worth automating.
Bins, trays and crates may create waiting time, lifting, floor congestion, dripping water, identification errors and repeated handling. Conveyors, elevators or controlled transfer systems can improve flow without changing the core washing or cutting technology.
Transfer automation deserves a high score when existing machines have sufficient capacity but material cannot move between them at the required rate. It deserves a lower score when the upstream or downstream process remains fundamentally unstable.
Worked Hypothetical Example: A Fresh-Cut Vegetable Facility
The following example is illustrative. It does not represent a TEEMYEAH customer, a guaranteed performance result or a standard industry benchmark.
A hypothetical fresh-cut vegetable facility wants to increase reliable output to 450 kilograms per hour. It processes lettuce, cabbage, carrots and mixed salad ingredients across one shift.
Production measurements indicate:
- Sorting and trimming generally keeps pace but uses considerable labor
- Washing averages approximately 430 kilograms of acceptable output per hour
- Cutting averages approximately 360 kilograms per hour during the major SKU sequence
- Dewatering averages approximately 410 kilograms per hour
- Mixing and packing can accept approximately 600 kilograms per hour under the current product mix
- A queue repeatedly develops before cutting
- Washing stops periodically because the cut-product buffer is full
- Cut-size rejects and rework vary by operator
- A faster cutting process would expose the current dewatering constraint
The management team assigns the following ratings.
Illustrative Automation Priority Calculation
| Process | Throughput 25 | Labor 15 | Yield/quality 15 | Food safety 20 | SKU fit 10 | Integration 10 | Commercial 5 | Total |
|---|---|---|---|---|---|---|---|---|
| Sorting and trimming | 3 | 4 | 3 | 2 | 2 | 4 | 3 | 59 |
| Washing | 4 | 3 | 3 | 5 | 3 | 3 | 4 | 74 |
| Cutting | 5 | 4 | 5 | 4 | 4 | 4 | 5 | 89 |
| Dewatering | 4 | 3 | 4 | 4 | 4 | 4 | 4 | 77 |
| Mixing and packing | 2 | 2 | 3 | 3 | 5 | 2 | 3 | 54 |
Cutting receives the highest score. It is the persistent throughput constraint, creates quality variation and supports a confirmed production objective.
The correct decision is not automatically to purchase the fastest available cutter. The facility should test its major vegetables, required cut specifications and changeover sequence. It should also verify that washing can supply the selected cutter consistently and that dewatering can absorb the new output.
Because dewatering already scores 77, the project team should model both stages. A targeted semi-automated cutting upgrade may be the first implementation phase, with a controlled buffer or dewatering improvement planned as the next gate.
Installing a fully integrated line immediately would require additional evidence: sustained demand, validated washing and dewatering parameters, acceptable sanitation time, layout feasibility and a clear packing interface.
Comparison: Manual Improvement, Semi-Automation or a Fully Integrated Line
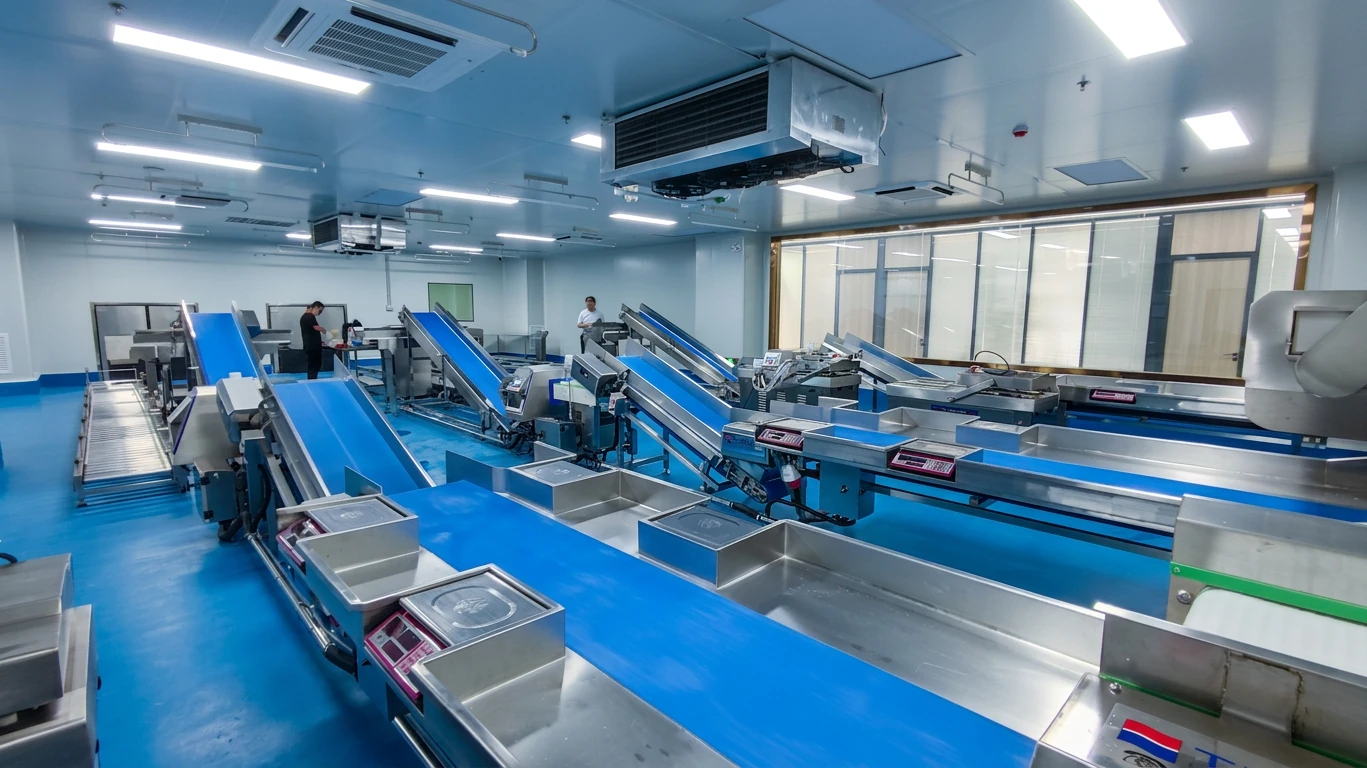
The selected process determines where to act. The operating context determines how far to automate.
| Decision factor | Manual process improvement | Semi-automation | Fully integrated line |
|---|---|---|---|
| Demand stability | Low or uncertain | Moderate, with repeatable core volume | Sustained and sufficiently predictable |
| Product mix | Highly variable, low-volume or judgment-intensive | Several repeatable SKU families | Product families compatible with planned line sequence |
| Bottleneck pattern | Temporary or caused by poor work organization | Concentrated in one or two steps | Several connected steps constrain flow |
| Labor problem | Can be reduced through work design or scheduling | Repetitive task has measurable labor burden | Labor and transfer dependence exists across the process |
| Quality variation | Mainly caused by unclear specifications or training | Machine can control a defined characteristic | Multiple steps require coordinated consistency |
| Capital requirement | Low | Moderate and staged | Higher, including transfer, controls and layout |
| Layout impact | Workstation-level changes | Local utilities and space modifications | Material flow, sanitation access and zoning redesign |
| Flexibility | Highest for unusual products | Balanced flexibility and repeatability | Strong within validated product families; lower for unplanned extremes |
| Maintenance need | Basic tools and supervision | Machine-specific preventive maintenance and spares | Coordinated maintenance, controls and line-recovery planning |
| Best fit | Early-stage, seasonal or highly customized operation | One verified process constraint | Stable volume with connected capacity and workflow needs |
When manual improvement is the better first decision
Manual preparation may remain commercially rational when:
- Daily volume is low
- Product specifications change constantly
- Raw materials require complex visual judgment
- Demand is temporary or unconfirmed
- The process does not constrain on-time output
- Labor and yield losses are minor
- Suitable equipment has not passed a product test
- The facility lacks the utilities, space or sanitation window required by the equipment
Possible improvements include workstation redesign, clearer specifications, improved knives and tools, line-side material presentation, smaller batch release, standardized container quantities, cross-training and more effective production sequencing.
OSHA’s poultry-processing ergonomics eTool identifies repetition, awkward posture, force, vibration and contact stress among ergonomic risk factors in that sector. Its examples are not universal benchmarks for every food operation, but they reinforce why manual improvement should address task design rather than considering labor cost alone.
When semi-automation is the better first decision
Semi-automation is often appropriate when one task has a high priority score but the overall process is not ready for continuous integration.
Examples include:
- A cutter with manual inspection and controlled feeding
- A peeling machine followed by manual finishing
- A washer connected to existing manual sorting tables
- A spin dryer loaded and discharged by operators
- A mixer with automated timing but manual ingredient addition
- A short conveyor replacing repeated crate carrying
This approach preserves operator judgment while reducing repetitive or capacity-limiting work. It also creates operating data for a later line-integration decision.
When a fully integrated line becomes reasonable
An integrated line is more defensible when several adjacent operations score highly and the business needs coordinated flow rather than an isolated capacity increase.
Typical conditions include:
- Stable target throughput
- Repeatable product families
- Confirmed customer or production demand
- Compatible capacities across washing, cutting, dewatering and packing
- Defined hygiene zones and product routes
- Adequate cleaning access
- Available utilities and drainage
- Maintenance personnel and spare-parts planning
- A recovery plan for equipment failure
- Sufficient space for inspection, buffers and operator access
Integration should not mean removing every person. Inspection, exception handling, verification, sanitation and maintenance may still depend on skilled employees.
U.S. Bureau of Labor Statistics data provide useful occupation-level context but should not be copied into a plant ROI model. BLS reported a May 2024 median annual wage of $40,050 for U.S. food processing equipment workers and projected approximately 37,500 openings per year on average from 2024 to 2034, many associated with replacement needs. Local wages, recruitment conditions, staffing models and job content can differ substantially.
Phase-Gate Rules for the Automation Decision
A high score places a process on the priority list. It does not authorize purchase. Move the proposal through the following gates.
Phase-Gate Table
| Gate | Required evidence | Stop or revise the project when |
|---|---|---|
| Gate 1: Constraint confirmation | Repeated throughput, queue, downtime, labor or quality evidence across representative runs | The apparent bottleneck disappears after scheduling, training or work-method correction |
| Gate 2: Product capability | Tests using representative and worst-case raw materials, required finished form and normal SKU changes | Yield, quality, damage, cleaning or changeover results are unacceptable |
| Gate 3: Food-safety and hygienic fit | Hazard review, material compatibility, cleanability, zoning, monitoring and sanitation assessment | The equipment creates uncontrolled niches, cross-flow or an incompatible control process |
| Gate 4: Line-balance fit | Verified upstream supply, downstream capacity, transfer method and buffer logic | The improvement merely creates a larger downstream queue |
| Gate 5: Operational readiness | Utilities, drainage, access, operators, maintenance, spare parts and recovery plan | The facility cannot operate, clean or restore the equipment reliably |
| Gate 6: Commercial case | Realistic labor, yield, capacity, sanitation, utility and maintenance assumptions | The project depends on unconfirmed sales, theoretical maximum capacity or unsupported savings |
| Gate 7: Post-installation review | Agreed acceptance criteria and comparison against the pre-installation baseline | The project cannot be evaluated using acceptable output, yield, quality and operating data |
Manual-improvement gate
Keep the process manual, at least temporarily, where the score is below 60 and the main causes are work organization, purchasing variation, unclear specifications or inadequate training.
Reassess after the improvement period. The score may fall because the problem has been corrected, or it may rise because the remaining technical constraint has become clearer.
Semi-automation gate
Proceed toward semi-automation where:
- The score is normally 60 or higher
- One process has a stronger case than adjacent operations
- Product testing is acceptable
- Operators remain valuable for inspection or exception handling
- Downstream processes can receive the projected output
- The equipment can operate without forcing a full facility redesign
A pilot, rental, demonstration or factory acceptance test can reduce uncertainty, although the available testing route depends on equipment type and supplier capability.
Integrated-line gate
Develop a full line concept where:
- Two or more connected stages score highly
- The facility has a defined production target
- Demand is sufficiently stable
- Product families and changeover rules are understood
- Material flow, people flow, waste flow and sanitation access can be planned together
- Controls and records can be integrated into the operating system
- Maintenance and line-recovery requirements are acceptable
The decision should be based on the performance of the complete process, not the sum of individual catalog capacities.
Food Safety Can Raise the Priority and the Approval Standard
A process with significant food-safety implications may receive a high score because inconsistency, uncontrolled handling or poor recordkeeping creates material risk. The same significance also increases the evidence required before automation is approved.
Where the FDA Preventive Controls for Human Food rule applies, covered facilities are generally required to evaluate known or reasonably foreseeable biological, chemical and physical hazards and implement written preventive controls when the hazard analysis determines they are required.
The FDA’s draft preventive-controls guidance describes a proactive, systematic approach involving hazard analysis, controls, monitoring, corrective actions, verification and associated records. FDA clearly identifies that document as draft, non-binding guidance. It also explains that preventive controls are intended to minimize relevant risk rather than create a zero-risk production system.
For automation planning, this means:
- A washer does not make produce sterile
- A sanitizer-dosing system does not validate the complete process
- A conveyor does not solve zoning or cross-contamination by itself
- Data recording does not prove that a control limit is scientifically appropriate
- Stainless-steel construction does not automatically make a machine hygienically suitable
- Reduced handling does not remove the need for sanitation procedures and trained personnel
Ready-to-eat products generally deserve particular attention because no later cooking step may be available to address hazards before consumption. Ready-to-cook and ready-to-eat products may use some of the same equipment categories, but their hazard analysis, zoning, changeover, sanitation and monitoring requirements can differ.
Calculate Economics Without Assuming Every Labor Hour Becomes a Saving
Payback analysis should use costs that the facility can support with evidence.
A basic calculation is:
Simple payback period = total project investment ÷ verified annual net benefit
Potential annual benefits may include:
- Labor hours actually removed or reassigned
- Reduced overtime
- Additional contribution from confirmed saleable output
- Lower measurable yield loss
- Reduced rework
- Fewer missed production or dispatch commitments
- Lower recurring handling cost
Potential additional costs may include:
- Utilities
- Water and wastewater
- Cleaning chemicals
- Sanitation labor
- Preventive maintenance
- Blades, belts, seals or other wear parts
- Spare-parts inventory
- Technical training
- Downtime risk
- Financing
- Facility modification
Do not treat every manual hour as immediate cash savings. Employees may remain necessary for feeding, inspection, cleaning, quality control or another constraint. The more defensible calculation distinguishes labor eliminated, labor reassigned and labor newly required.
Likewise, theoretical additional capacity has no economic value unless the operation has demand, downstream capacity and working capital to use it.
When You Should Not Automate the Highest-Scoring Process Yet
A high score may identify a serious problem while still failing the implementation gates.
Delay or redesign the project when:
- The production data are unreliable
- The product specification has not been finalized
- The supplier has not tested representative raw materials
- Seasonal variation has not been evaluated
- The machine requires uniform feed that the upstream process cannot provide
- The downstream step cannot accept the projected output
- RTE and RTC flows are not adequately separated
- Cleaning access is insufficient
- The sanitation window is too short
- The facility cannot support preventive maintenance
- Spare parts or technical support are unsuitable for the operating location
- Demand depends on an unconfirmed contract
- Management expects equipment to compensate for weak supervision or inadequate training
The correct response may be to stabilize the process, redesign the layout or improve the raw-material specification before purchasing equipment.
The Cost of Automating the Wrong Step
Wrong prioritization can create several forms of loss.
A transferred bottleneck
Increasing cutting output from 300 to 800 kilograms per hour has little value where dewatering or packing remains limited to 350 kilograms per hour. The new machine may spend much of the shift idle while WIP increases.
Lower yield at higher speed
A machine may process more input while producing more trim loss, breakage or unusable product. Output should therefore mean acceptable output, not material fed into the machine.
Longer cleaning and changeover
Equipment that performs well during one long run may be unsuitable for a central kitchen producing many short batches. The time saved in processing can be lost during disassembly, cleaning, tool replacement and restart.
Reduced product flexibility
A specialized machine may suit one stable SKU but create workarounds for the rest of the product range. Assess the percentage of total production that the equipment can handle acceptably, not only the performance of the easiest product.
New food-safety and traceability gaps
Poor transfer design may cross raw and cleaned-product routes. Large buffers can weaken time and temperature control. Shared equipment can complicate allergen changeover. Automated output without reliable batch identification may create traceability problems.
Greater dependence on maintenance
Automation replaces some manual variability with technical dependence. Sensors, controls, blades, motors, bearings and transfer components require inspection and maintenance. A line without a recovery plan can lose more output during one failure than a flexible manual process.
Automation Is a Process Redesign, Not a Machine Purchase
The most suitable first automation project often becomes clear only after the facility maps the complete flow.
Trace the product from receiving through storage, sorting, trimming, peeling, cutting, washing, dewatering, mixing, inspection, packing and cold storage. Record where operators intervene, where batch identity changes, where product waits and where raw, cleaned, RTE, RTC, allergen or waste flows intersect.
The first machine should improve the performance of this system. It should not be treated as an independent asset.
A disciplined sequence is:
- Define the finished product and acceptance criteria.
- Measure actual process performance.
- Identify the persistent constraint.
- Score candidate processes.
- Correct low-cost manual causes.
- Test representative products.
- model the new line balance.
- Review food safety, sanitation and layout.
- Select the appropriate automation level.
- Establish acceptance and post-installation metrics.
This approach may lead to a cutter, washer, peeler, dryer, mixer or transfer system. It may also show that the correct first investment is a better layout, standardized workstation or buffer-control method.
The strongest answer to which process should be automated first is therefore not a universal equipment category. It is the operation with the highest verified combined impact on acceptable throughput, labor, yield, quality, food-safety control and commercial performance—provided the rest of the process is ready to use the improvement.
Use the Automation Priority Worksheet
Apply the worksheet to each preparation step using actual production data rather than rated machine capacity. Compare the scores, review the phase gates and identify whether the immediate need is manual improvement, semi-automation or a coordinated line concept.
For a preliminary process recommendation, provide TEEMYEAH with your raw material, required finished form, current and target throughput, product mix and SKU sequence, shift pattern, existing process, available layout and hygiene constraints. This information can be used to assess capacity matching, equipment configuration, product-testing needs and a possible custom food pre-processing line without assuming that full automation is necessary.
FAQ
1. Which food process should you automate first?
Automate the process that persistently limits acceptable finished output and has a technically suitable improvement path. Measure actual throughput, queues, labor hours, yield, quality variation, downtime, sanitation time and food-safety significance across representative runs. Compare washing, cutting, peeling, trimming, dewatering, mixing, packing and transfer using the same weighted criteria. The highest-scoring process should still pass product testing, hygienic-design review, line-balance analysis and an economic gate. A high labor count alone is not enough, because automating a non-bottleneck may reduce staffing without improving total output or delivery performance.
2. Is the production bottleneck always the slowest machine?
Not necessarily. The constraint may be a manual transfer, inspection table, sanitation procedure, changeover, product-release decision or packing operation rather than a machine. A high-capacity machine can also operate below its rated output because it is starved of material or repeatedly interrupted. Identify the bottleneck by measuring acceptable output, WIP queues, waiting time and the effect of each process on the complete production target. The relevant constraint may change between SKUs, shifts or seasonal raw-material conditions, so observations should cover representative production rather than one isolated run.
3. Should labor cost be the main factor in food preparation automation?
Labor cost is important but should not be the only factor. A process with many employees may still be flexible, productive and commercially suitable. Another process with fewer workers may constrain output, create excessive yield loss or expose employees to more repetitive and forceful work. Include direct labor hours, overtime, recruitment difficulty, training, absence sensitivity and ergonomic exposure in the assessment. Also evaluate whether automation truly removes labor or merely shifts employees to feeding, inspection, cleaning and maintenance. Plant-specific wage and staffing data are more useful than national occupational averages when calculating savings.
4. How many days of production data are needed before choosing a process?
There is no universal number. The data period must capture normal volume, peak demand, important SKU families, difficult raw materials, common staffing conditions and representative changeovers. Five to ten production days may provide an initial baseline in a stable operation, while seasonal or highly variable facilities may need a longer study. The aim is to confirm that the constraint repeats and is not caused by a single equipment fault, supplier problem or unusual staffing shortage. Record information by SKU and time period because monthly averages can conceal short but commercially important bottlenecks.
5. When is semi-automation better than full automation?
Semi-automation is usually better when one or two repetitive processes have a clear equipment fit but the overall workflow still requires operator judgment or flexibility. It can reduce cutting, peeling, washing, drying, mixing or transfer labor while retaining manual inspection and exception handling. It also limits capital exposure and generates data for a later expansion decision. Full integration becomes more reasonable when several adjacent processes constrain flow, volumes are stable, SKU families are compatible, sanitation requirements are defined and the business needs coordinated material transfer rather than isolated machine capacity.
6. Can an automated washer solve food-safety problems?
An automated washer can improve process control, repeatability, handling and monitoring, but it cannot independently establish food safety. The complete process must be evaluated through the facility’s applicable hazard analysis, sanitation program, operating limits, monitoring, verification, corrective actions and records. Raw-material condition, water management, organic load, product residence time, equipment cleanability and post-wash handling all matter. Ready-to-eat production may require different controls from ready-to-cook preparation. A supplier demonstration should therefore assess product condition and process compatibility without being treated as validation of the facility’s entire food-safety system.
7. How should yield be included in an equipment decision?
Measure acceptable output relative to input before and during equipment testing. Include over-trimming, peeling loss, breakage, bruising, incorrect cut size, rework and unusable product. A machine that processes more input per hour may still reduce commercial output if it damages product or removes too much saleable material. Compare performance across representative sizes, varieties and raw-material conditions rather than using only an ideal sample. Yield should also be evaluated with labor and quality: a small reduction in manual trimming may not justify equipment that creates a larger raw-material loss.
8. What happens when the automated process becomes faster than the next step?
The downstream process becomes the new bottleneck. Product may accumulate in containers, remain exposed longer, require extra handling or interfere with temperature and sanitation controls. Before purchasing equipment, model the projected output against the capacities of upstream supply, downstream processing, inspection and packing. A controlled buffer may absorb short fluctuations, but it should not be used to conceal a permanent mismatch. The solution may require speed control, staged discharge, a second downstream machine, revised scheduling or a connected line rather than maximum standalone capacity.
9. When should a manual food preparation process remain manual?
Manual preparation remains reasonable when volumes are low, products change frequently, raw materials require complex visual judgment or demand is uncertain. It may also be preferable where suitable equipment cannot meet yield, quality, sanitation or changeover requirements. Improve workstation design, tools, material presentation, specifications, scheduling and training before assuming automation is necessary. Reassess the process after these changes. If the operation then meets throughput and quality requirements without excessive labor or risk, automation may not be commercially justified even when equipment is technically available.
10. What information should be sent to an equipment supplier for an initial recommendation?
Provide the raw material and its size or condition range, required finished form, current and target hourly throughput, daily volume, SKU list, production sequence and shift pattern. Include the existing process, labor by step, major queues, quality problems, yield data, cleaning requirements and whether the product is ready-to-cook or ready-to-eat. A floor plan should identify usable space, doors, columns, drainage, utilities, cold rooms and packing interfaces. Product photos, samples or processing videos can help determine whether testing is necessary before equipment and line capacity are selected.
Data and Source Note
The Automation Priority Score, weighting, rating bands, worksheet and hypothetical calculation are editorial decision tools developed for this article. They are not regulatory standards, published industry benchmarks, guaranteed performance levels or investment promises. The hypothetical facility and all related operating figures are illustrative.
The FDA final rule page confirms that the Preventive Controls for Human Food rule became final in September 2015 and describes hazard analysis, written preventive controls, monitoring, sanitation controls, training and related food-safety-plan requirements for covered facilities, subject to applicability and exemptions.
The FDA preventive-controls guidance page identifies the document as January 2024 draft guidance, “not for implementation,” containing non-binding recommendations. It distinguishes the guidance from legally enforceable requirements and explains that preventive controls minimize relevant risks rather than create a zero-risk system.
NIST IR 8188 defines general manufacturing KPIs including throughput rate, input feed rate, output yield, equipment availability, continuous-operation duration, unplanned stops, production effectiveness, capacity utilization and unit cost. The report concerns general manufacturing/process-control measurement and is not a food-industry regulation.
NIST IR 7911 discusses manufacturing-operation KPIs such as worker efficiency, throughput, utilization efficiency, first-pass yield, scrap, rework, equipment load, mean operation time between failures and restoration time. It is used here only as a general manufacturing measurement reference.
The OSHA Poultry Processing Industry ergonomics eTool identifies repetition, awkward posture, force, vibration and contact stress as ergonomic concerns and explains that job and workstation design can influence musculoskeletal risk. Its examples are specific to poultry processing and should not be treated as universal food-industry exposure limits.
The U.S. Bureau of Labor Statistics reported a May 2024 median annual wage of $40,050 for food processing equipment workers and projected approximately 37,500 openings per year on average over 2024–2034. These are U.S. occupation-level figures, not a forecast of staffing, wages or savings for any individual facility.

