




Summary
Central kitchen ROI for restaurant chains depends on the operating model, not an industry-average payback claim. Build the decision from store count, accepted kilograms per store, production days, outlet labor, raw-material yield, central labor, utilities, sanitation, logistics, maintenance, investment and planned capacity reserve. The downloadable model converts those inputs into annual demand, required kg/h, cost differences, simple payback and an approximate break-even store count. Example values are clearly marked and are not TEEMYEAH customer results. If demand is unstable, SKU definitions are incomplete or the hub would concentrate unacceptable downtime and delivery risk, validate a hybrid or staged option before committing to a full centralization project.
Establish the Decentralized Preparation Baseline Before Requesting ROI Claims
The baseline should be observed, not reconstructed from payroll totals alone. Outlet teams rarely record preparation labor as a separate cost center. An employee may receive vegetables, wash lettuce, prepare onions, assist cooking, clean the area and serve customers within one shift. Assigning the entire shift to preparation exaggerates the opportunity; counting only active cutting time understates it.
A time study should cover representative outlets, weekdays, weekends, delivery days and menu peaks. Record paid minutes for:
-
receiving and moving raw ingredients;
-
sorting and inspection;
-
washing and sanitizing;
-
peeling and trimming;
-
cutting or shredding;
-
portioning and labeling;
-
cleaning tools, machines and workstations;
-
handling waste;
-
completing production and temperature records;
-
waiting for equipment, sinks or workspace;
-
correcting non-conforming cuts or portions.
Report the result as labor hours per 1,000 kilograms of saleable output, not only hours per outlet. This permits comparison across stores with different sales volumes.
The U.S. Bureau of Labor Statistics reported a May 2025 median hourly wage of USD 16.98 for U.S. food preparation workers. That figure is useful only as a national occupational benchmark. It is neither a global wage assumption nor a fully loaded employer cost. A restaurant group must substitute local wages, benefits, payroll taxes, paid leave, overtime premiums, recruitment, uniforms, training and other applicable burdens.
The fully loaded labor rate can be calculated as:
Fully loaded hourly labor cost = (annual wages + employer payroll costs + benefits + recurring employment costs) ÷ productive paid hours
Productive paid hours should reflect paid leave, training, meetings and realistic attendance. Do not divide annual cost by theoretical scheduled hours if those hours are not available for production.
Recruitment difficulty, absenteeism and turnover also affect operations, but they require careful treatment. Overtime and temporary-worker spending are cash costs when documented. Management inconvenience or general concern about labor availability is not automatically a financial saving.
Separate Avoided Outlet Costs from New Central Costs
The most common error in a central kitchen ROI calculation is counting benefits without rebuilding the central cost base. A second error is counting the same saving twice—for example, valuing trim reduction as both improved yield and lower waste-disposal quantity without checking whether both changes are separately measurable.
| Cost area | Decentralized baseline | Potential avoided outlet cost | New or expanded central cost | Main evidence required |
|---|---|---|---|---|
| Preparation labor | Repeated washing, cutting, cleaning and recording | Hours removed from paid schedules | Hub operators, sanitation staff and residual outlet handling | Time studies, rosters, payroll rates |
| Ingredients and yield | Raw purchases needed for outlet edible output | Reduced raw-material purchases for equal usable output | Hub sorting rejects, storage loss and transport damage | AP and EP weights by SKU |
| Waste | Trim, spoilage and rejected portions at outlets | Collection, handling or disposal costs genuinely removed | Concentrated waste handling and wastewater treatment | Waste weights and invoices |
| Consistency and rework | Incorrect cuts, portions or recipe preparation | Verified remakes, overportioning or credits avoided | Central inspection, specification control and hold procedures | Non-conformance and rework records |
| Space and rent | Prep rooms, sinks, storage and equipment footprint | Lease area surrendered or future expansion avoided | Hub rent, cold rooms, docks and circulation space | Lease terms and approved expansion plan |
| Utilities | Water, power, hot water and drainage at many sites | Metered or contractually avoidable outlet consumption | Central process water, refrigeration, power and wastewater | Submetering or engineering estimates |
| Equipment | Duplicated cutters, sinks, benches and small tools | Purchases, leases and maintenance discontinued | Processing line, ancillary systems, installation and spares | Asset register and supplier scope |
| Supervision | Managers oversee preparation in every location | Manager hours removed from schedules | Production manager, planner and quality supervision | Time study and organization design |
| Sanitation | Repeated cleaning at outlets | Chemicals, labor and consumables removed | Longer central cleaning, verification and environmental controls | Sanitation schedule and cost records |
| Logistics | Whole ingredients delivered to outlets | Possible consolidation of inbound deliveries | Prepared-product dispatch, vehicles, fuel, crates and cold chain | Route model and delivery frequency |
| Packaging | Limited internal packaging | Any outlet containers discontinued | Bags, liners, labels, crates and return logistics | Packaging bill of materials |
| Quality systems | Multiple local records and checks | Some duplicated checks removed | Specifications, lot control, testing, release and traceability | Quality plan and legal review |
| Downtime | Failure affects one outlet | Small local disruptions may be reduced | One hub failure can affect the network | Reliability plan and recovery capacity |
| Transition | Existing process already operating | None | Dual running, training, validation, launch waste and consultancy | Implementation plan |
| Financing and accounting | Existing assets may be depreciated | Disposal proceeds where realizable | Interest, fees, depreciation and tax effects | Finance policy and funding terms |
Only incremental differences belong in the decision model. If current outlet rent continues unchanged, the released preparation area is not a cash saving. If the area allows additional seats, a new sales station or postponed relocation, it may have capacity value, but that value belongs in a separate scenario supported by an approved operating plan.
Yield Must Be Calculated from As-Purchased to Edible Portion
Yield is the ratio between usable output and the quantity purchased or introduced into the measured process:
Edible-portion yield = accepted edible output ÷ as-purchased input × 100
Raw material required = required edible output ÷ expected yield
Annual ingredient saving = (baseline raw material required − proposed raw material required) × purchase cost per kilogram × operating days
The USDA Food Buying Guide uses yield as a planning, purchasing and food-cost-control tool and distinguishes purchased quantity from edible portions. It also warns that quality, storage, handling, equipment, cooking and portion control can affect results. Its published figures serve particular U.S. child nutrition program purposes; they are not automatic central-kitchen guarantees. USDA recommends documented in-house studies when actual operation yields differ.
A restaurant chain should conduct product-specific trials using representative raw materials. Potatoes of different sizes, mature cabbage, delicate lettuce and irregular onions will not produce the same yield. Seasonal condition, storage age, peeling depth, trimming standard, blade selection and operator decisions all matter.
The trial record should include:
-
supplier and lot;
-
product variety, size range and condition;
-
as-purchased weight;
-
sorting rejects;
-
peel and trim waste;
-
acceptable cut output;
-
damaged or off-specification output;
-
retained water where washing changes measured weight;
-
time, staffing and equipment settings;
-
usable output after any required holding or transport simulation.
Yield improvement and waste reduction are related, but they are not automatically two separate savings. Lower raw-material purchases normally capture the value of reduced trim. Add disposal savings only when the disposal charge also changes and is separately documented.
Labor, Throughput and Line Balance Must Be Measured Together
A machine’s catalog capacity does not equal the hub’s saleable output. Practical throughput is governed by the slowest constrained process under the actual product mix.
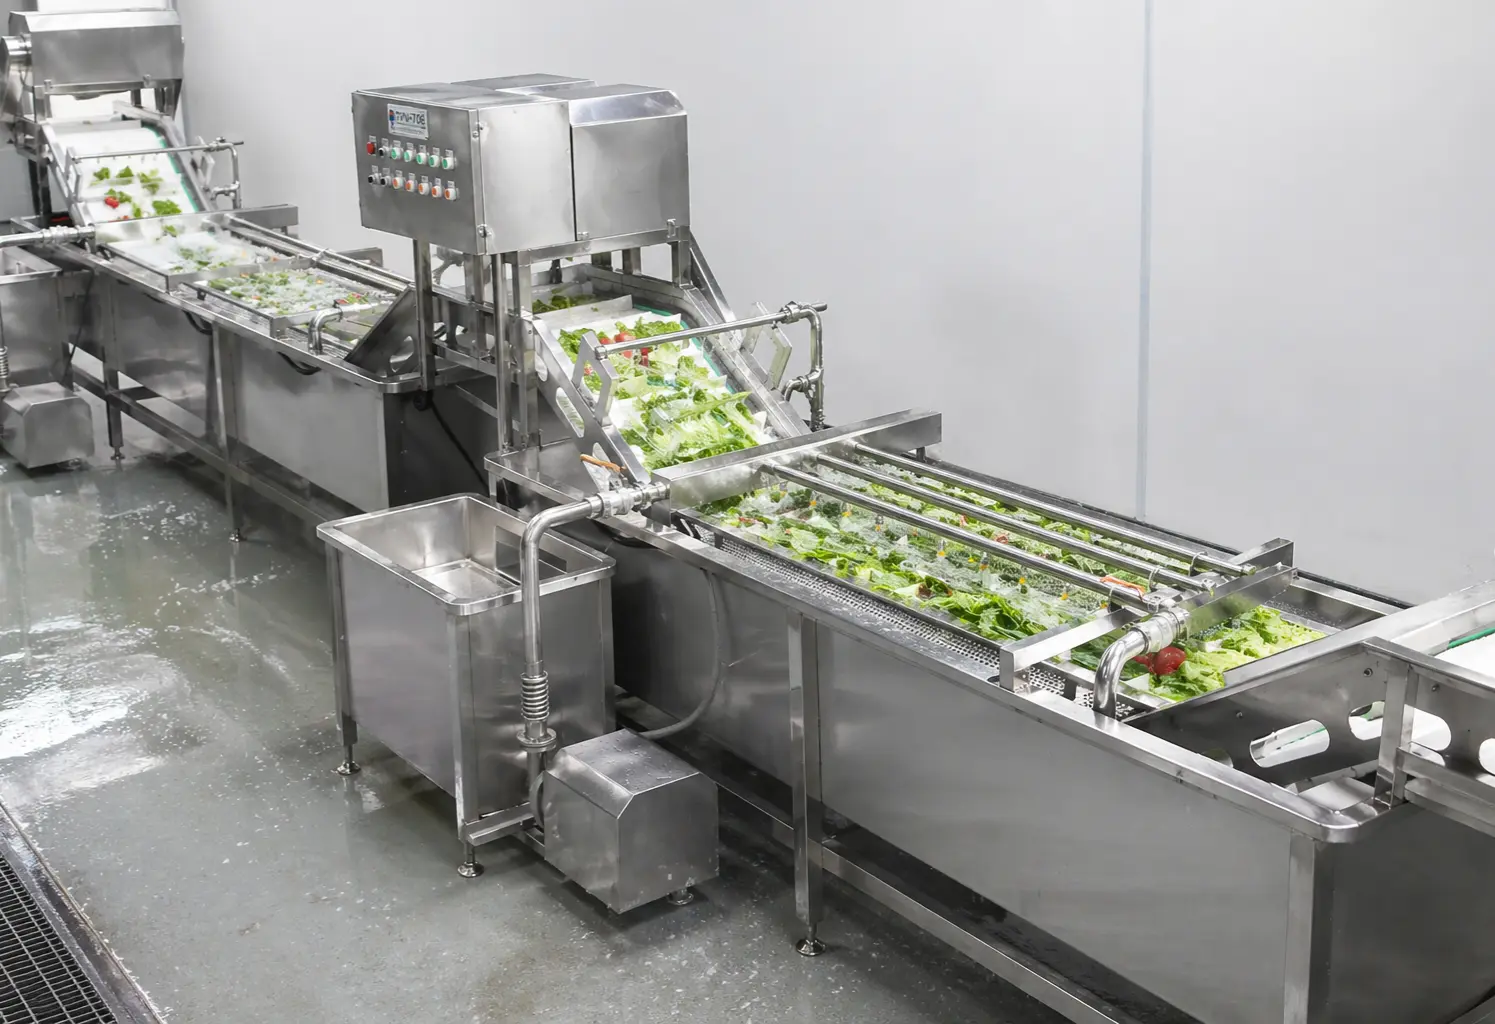
A vegetable processing line may include receiving, sorting, peeling, washing, cutting, inspection, dewatering, mixing, weighing, packing and dispatch. A nominally fast cutter creates no network benefit if inspection, batch dewatering or packing cannot keep pace. Accumulating work in process can increase waiting time, temperature exposure, handling and floor congestion.
Useful operating measures include:
Labor productivity = saleable output ÷ total direct and sanitation labor hours
Labor intensity = total direct and sanitation labor hours ÷ saleable output in tonnes
Practical throughput = accepted saleable output ÷ elapsed production time
Downtime rate = unplanned downtime ÷ scheduled production time × 100
On-time completion rate = production orders ready by dispatch cutoff ÷ total production orders × 100
Changeover burden = cleaning and setup minutes ÷ scheduled production minutes × 100
Measure the whole shift. Feeding, product changeovers, cleaning, blade changes, inspection, crate movement and minor stops can create a large difference between theoretical and sustainable throughput.
SKU complexity also matters. Ten products requiring different cuts, sanitation conditions or allergen controls cannot be treated as one continuous run. The ROI model should contain the actual production sequence and the number of changeovers expected on a representative day.
Break-Even Logic at Network Level
In the illustrative model, assume 348,000 CU of annual central costs remain fixed within the current operating range. Variable central costs serving 40 outlets total approximately 318,000 CU. Gross avoided outlet costs and savings total about 830,936 CU.
Annual contribution before central fixed costs is therefore approximately:
830,936 − 318,000 = 512,936 CU
Contribution per outlet is:
512,936 ÷ 40 = 12,823 CU per outlet
Operating break-even is:
348,000 ÷ 12,823 = 27.1 outlets
Since a fraction of an outlet cannot be served, the illustrative hub needs approximately 28 comparable outlets to cover its central fixed operating burden.
This does not mean every 28-outlet network should centralize. Outlet volumes, preparation intensity, distance, product mix and service frequency may differ greatly. The calculation also assumes central costs do not step up before outlet 28 and that each additional location resembles the modeled outlet.
A more accurate multi-format chain should calculate contribution by outlet cluster. A high-volume urban restaurant may make a strong contribution because it is close to the hub and removes many preparation hours. A remote, low-volume location requiring a separate refrigerated route may contribute very little or even reduce network cash flow.
Capacity and Expansion Decision Gate
A financially attractive model can still fail if the proposed line cannot reliably meet peak dispatch requirements. Capacity should therefore operate as an investment gate, not merely as a future benefit.
Calculate practical saleable capacity as:
Practical saleable capacity = proven bottleneck input rate × net scheduled production hours × weighted edible-portion yield
Net scheduled hours exclude planned sanitation, product changeovers, breaks and known non-production periods. The proven bottleneck rate should come from representative product testing or a carefully bounded engineering estimate—not the highest catalog rating of one machine.
Peak capacity utilization = peak required saleable output ÷ practical saleable capacity × 100
Management must define its acceptable utilization ceiling based on recovery time, demand variability, shelf-life constraints and backup options. There is no universal safe percentage. A hub producing shelf-life-sensitive ready-to-eat ingredients with fixed morning dispatch deadlines may require more recovery headroom than a facility processing stable ready-to-cook materials over a longer production window.
The expansion gate should ask:
-
Can the hub supply current peak demand after changeovers and sanitation?
-
Can it cover confirmed outlet openings during the investment payback horizon?
-
Which stage reaches its constraint first?
-
Can that stage be expanded independently?
-
Does expansion require another machine, shift, cold room, packing station, dock or delivery route?
-
When does the next fixed-cost step occur?
-
Is floor space, drainage, power and refrigeration reserved for that step?
-
What happens if the bottleneck is unavailable during the dispatch window?
The central kitchen capacity guide examines broader sizing decisions. For ROI purposes, the critical point is whether growth strengthens contribution within existing capacity or triggers another investment earlier than the base model assumes.
Expansion capacity should not automatically be valued as future profit. Count committed openings or approved growth plans in a scenario. Keep speculative expansion as strategic upside.
Information Required Before Approving the Business Case
A restaurant chain should assemble the following project dataset:
Network and demand
-
current and planned outlet count;
-
volume by outlet and day;
-
peak-day and peak-hour demand;
-
confirmed openings and expected dates;
-
delivery windows and route distances.
Product and process
-
raw materials, varieties and seasonal conditions;
-
required finished forms and cut sizes;
-
as-purchased and edible-portion weights;
-
RTC and RTE classification;
-
recipes, SKU count and changeover sequence;
-
required shelf life and temperature conditions.
Cost baseline
-
task-level outlet labor hours;
-
fully loaded labor rates;
-
overtime, agency and recruitment costs;
-
ingredient purchase prices;
-
existing equipment ownership and maintenance;
-
sanitation, utilities and waste charges;
-
attributable occupancy and planned outlet expansion.
Central operating assumptions
-
central staffing by role and shift;
-
residual outlet labor;
-
route, vehicle and cold-chain cost;
-
packaging and crate system;
-
rent and facility modifications;
-
utility and wastewater requirements;
-
quality, testing and traceability resources;
-
maintenance, spares and supplier support;
-
transition and working-capital needs.
Validation evidence
-
representative raw-material tests;
-
measured yield;
-
accepted output quality;
-
sustained throughput;
-
product damage;
-
cleaning and changeover time;
-
operator requirements;
-
line balance;
-
utility consumption under stated test conditions;
-
acceptance criteria and responsibilities.
With these inputs, TEEMYEAH can review the process flow, identify which tasks are suitable for centralization, examine equipment matching and develop a project concept for commercial assessment. The central preparation workflow guide provides additional context for mapping receiving, processing, storage and dispatch interfaces.
When Centralization or Automation Is Not the Right Investment
Outlet-level preparation can remain economically rational when:
-
the network has few outlets or low common preparation volume;
-
stores are geographically dispersed;
-
delivery routes would be long or unreliable;
-
local labor is available and preparation work fits productively within existing shifts;
-
menus vary substantially by location;
-
ingredients deteriorate quickly after cutting;
-
outlets require last-minute customization;
-
current yield and consistency are already well controlled;
-
outlet space cannot be released or productively reused;
-
the proposed hub introduces disproportionate rent, refrigeration or compliance costs;
-
central downtime would create unacceptable network exposure.
A hybrid model is often better when only some processes have repeatable volume. Centralize the tasks supported by measurable demand and retain the rest locally.
Semi-automation is appropriate when one or two labor-intensive bottlenecks justify equipment but product variety, changeover frequency or uncertain demand makes full line integration premature. Manual inspection may also remain valuable when raw materials vary significantly.
A more integrated vegetable processing line becomes meaningful when common volume is sufficient, upstream and downstream capacity can be balanced, product specifications are stable, sanitation can be engineered, and the network can convert labor or expansion headroom into measurable business value.
The wrong equipment configuration can reduce rather than improve yield, damage delicate products, create excessive changeover time or move the bottleneck downstream. A supplier’s high nominal capacity is not a substitute for representative testing and a complete process-flow review.
Download the Central Kitchen ROI Model
The Inputs, Calculation, Summary and Notes sheets separate avoided outlet work from the new costs of central labor, utilities, sanitation, logistics, maintenance and project investment. Example-only values can be replaced without changing the formula structure.
After completing the workbook, attach it with the product photos, layout or operating records requested on this page. TEEMYEAH will use the submitted inputs to prepare the next defined engineering step; the download itself is not a quotation or validation result.
Frequently Asked Project Questions
Which number should drive central-kitchen capacity?
Use accepted kilograms required inside the production and dispatch window, then work backward through product yield and planned downtime. Daily average demand alone can understate the peak requirement.
How should yield improvement be entered in the model?
Use a measured or buyer-owned assumption for as-purchased input divided into accepted output. Do not copy an unrelated project’s yield into the model.
When is a hybrid model more useful than full centralization?
A hybrid can fit unstable demand, many short runs, high logistics risk or a network that needs to validate a few high-volume SKUs before moving the rest.
How is the approximate break-even store count calculated?
The workbook divides the modeled central operating cost by per-store gross benefit while holding the selected central configuration constant. Recalculate the configuration when capacity, routes or staffing must step up.
What should be sent after the model is completed?
Send the workbook with store demand, SKU list, cut formats, product photos, production window, utility assumptions and a dimensioned layout. TEEMYEAH can then review a preliminary equipment configuration.

